ZenUML: Creating Sequence Diagrams and Flowcharts Based on Simple Text Code
General Introduction
ZenUML is a multi-platform diagram-as-code solution focused on creating sequence diagrams and flowcharts. It avoids delays in server-side interactions by rendering diagrams in real-time in the browser, so that the user's thought process is not interrupted by inefficient drag-and-drop operations or slow loading animations.ZenUML's diagrams are not just static images, but the user can interact with the diagrams, e.g., by highlighting the message on the diagram in editing mode that automatically selects the corresponding code.ZenUML emphasizes on privacy and security, never sending data to the server for rendering to ensure the security of the user's data. It never sends data to the server for rendering to ensure the security of user data. The tool is OMG UML 2.5.1 compliant and offers rich extensions, such as cloud icons, to make diagrams more readable.ZenUML is used in a wide range of industries such as fintech, telecom and retail, and is supported on a variety of platforms, including Confluence, web apps, browser extensions, IDE plug-ins, and desktop applications.
Function List
- Real-time rendering: Renders charts in real-time in the browser without server-side interaction.
- Interactive Charts: Users can interact with charts and quickly navigate complex charts.
- Privacy and security: No data is sent to the server for rendering, ensuring data security.
- Standards compliance: Conforms to OMG UML 2.5.1 standard and provides rich extended functionality.
- Multi-platform support: Confluence, web applications, browser extensions, IDE plug-ins and desktop applications are supported.
- Simpler DSL: Use a simpler DSL language to reduce lines of code and improve readability and maintainability.
- Professional Support: Installation, training and troubleshooting support is provided, with most issues resolved within 8 hours.
- Rich extensions: such as cloud icons to make charts more readable.
Using Help
Installation process
- Web Application Usage::
- Visit the ZenUML website (https://zenuml.com/).
- Register and log in to your account.
- Enter the workspace and start creating the chart.
- Confluence Plugin Installation::
- In the Confluence Administration Backend, select Apply.
- Search for "ZenUML" and click "Install".
- Once the installation is complete, add the ZenUML macro to the page to begin creating the diagram.
- Browser Extension Installation::
- Search for "ZenUML" in your browser extension store.
- Click "Add to Browser" and follow the instructions to complete the installation.
- Once the installation is complete, click on the ZenUML icon in the browser toolbar to begin creating the diagram.
- IDE plug-in installation::
- Search for "ZenUML" in the IDE's plugin market.
- Click "Install" and follow the prompts to complete the installation.
- Once the installation is complete, open the ZenUML plugin in the IDE and start creating diagrams.
Usage Process
- Creating Sequence Diagrams::
- Select "New Chart" in the workspace.
- Select the Sequence Diagram template.
- Write code using ZenUML's DSL language, for example:
Alice -> Bob: Hello Bob, how are you? Bob --> Alice: I am good thanks!- Preview charts in real time to make adjustments and optimizations.
- Creating Flowcharts::
- Select "New Chart" in the workspace.
- Select the Flowchart template.
- Write code using ZenUML's DSL language, for example:
start :Step 1; :Step 2; :Step 3; end- Preview charts in real time to make adjustments and optimizations.
- Exporting and sharing charts::
- When you have finished creating the chart, click the "Export" button and select the export format (PNG, SVG, etc.).
- Share charts via link or embed code.
- Advanced Features::
- Enhance chart readability with cloud icons and other extensions.
- Highlight messages on the chart in edit mode to quickly navigate the code.
- Visit the ZenUML Help Center for more tips and support.
common problems
- How to ensure data security? ZenUML does not send data to the server for rendering, all operations are done locally to ensure data security.
- How do I get technical support? Visit the ZenUML Help Center to submit a support request, most issues are resolved within 8 hours.
- Does it support teamwork? ZenUML supports team collaboration, where users can share diagram links and edit and view diagrams together.
Schematic Sharpener D2
There are many tools for making schematics.
I like to use text code based diagramming tools for wireframe diagrams like Mermaid, Plantuml, Graphviz.
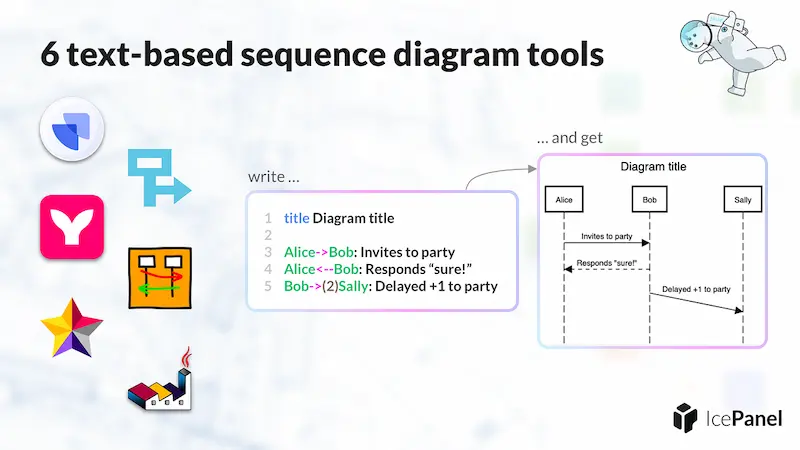
They all generate images, based on the code, and are perfect for putting into code repositories for versioning.
Recently, I discovered a much easier-to-use tool of its kind D2The following is a simple, intuitive and powerful program.

D2 can be used on the command line or in the browser. Suppose you have an image code fileexample.d2Then the command to generate the image is as follows.
$ d2 example.d2
Most of the time I use it through my browser. It has an online generator play.d2lang.com(Below), paste the code in, press the "compile" button, and the image will be generated immediately.
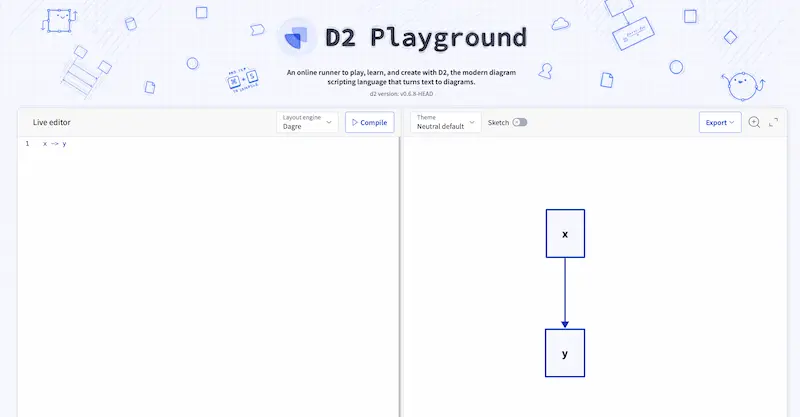
If you want node A (the name of the node is A), just type A.
A

A is just the name of the node, if you want to customize the content of the node, write it like below.
A: A

Next, add a node.
A: A
B: B
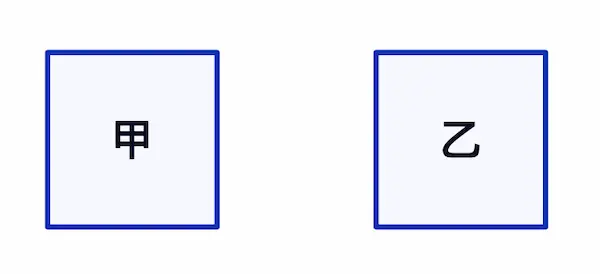
Connect them.
A: A
B: B
A -> B
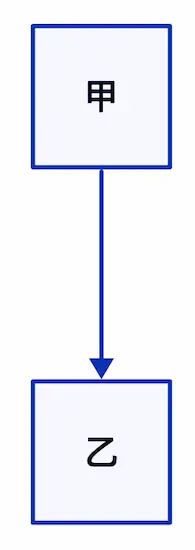
The connection can be made with a positive arrow (->), or you can use the reverse arrow (<-), and even bidirectional arrows (<->). If you don't need arrows, just connect the lines (--).
Text can also be added to the arrows.
A: A
B: B
A -> B: Connection
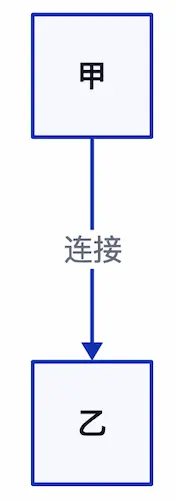
There can be multiple connections between nodes.
A: A
B: B
A -> B: Request
A <- B: Response
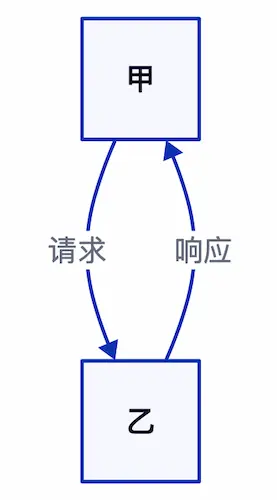
Node connections can also be written on one line.
A -> C <- B: Connections
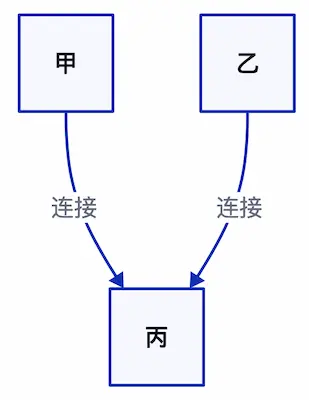
Stage 1 -> Stage 2 -> Stage 3 -> Stage 4
Stage 4 -> Stage 1: Feedback
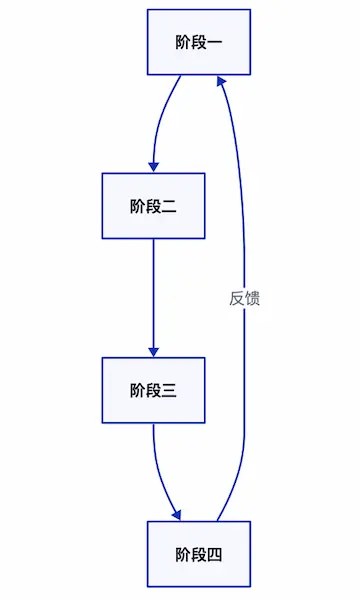
This syntax is enough to draw a basic wireframe diagram, isn't it quite simple.
D2 can draw very complex diagrams, for more syntax see(computer) fileThe
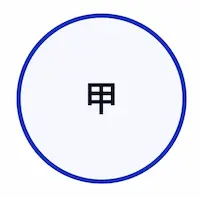
One last mention, if you want to change the node shape, the box is changed to a circle, as written below.
A: A
A.shape: circle
The shape can even be changed to a cloud to indicate a cloud service.
A: A
A.shape: cloud

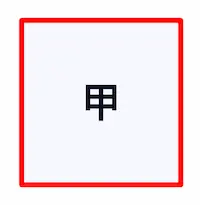
The line color can also be changed.
A: A
A.style.stroke: red
© Copyright notes
Article copyright AI Sharing Circle All, please do not reproduce without permission.
Related articles

No comments...

