GitDiagram: Visualize the structure of your GitHub codebase and turn your code repository into an interactive system architecture diagram.
General Introduction
GitDiagram is an innovative GitHub codebase visualization tool that quickly transforms any GitHub repository into an interactive system architecture diagram. It uses advanced AI technology (Claude 3.5 Sonnet) to give developers a new way to view and understand their codebase. Users simply replace "hub" with "diagram" in the GitHub URL to instantly generate a visual diagram of the corresponding repository. GitDiagram is developed using a modern technology stack, including Next.js, FastAPI, and PostgreSQL, ensuring high performance and reliability. High performance and reliability.
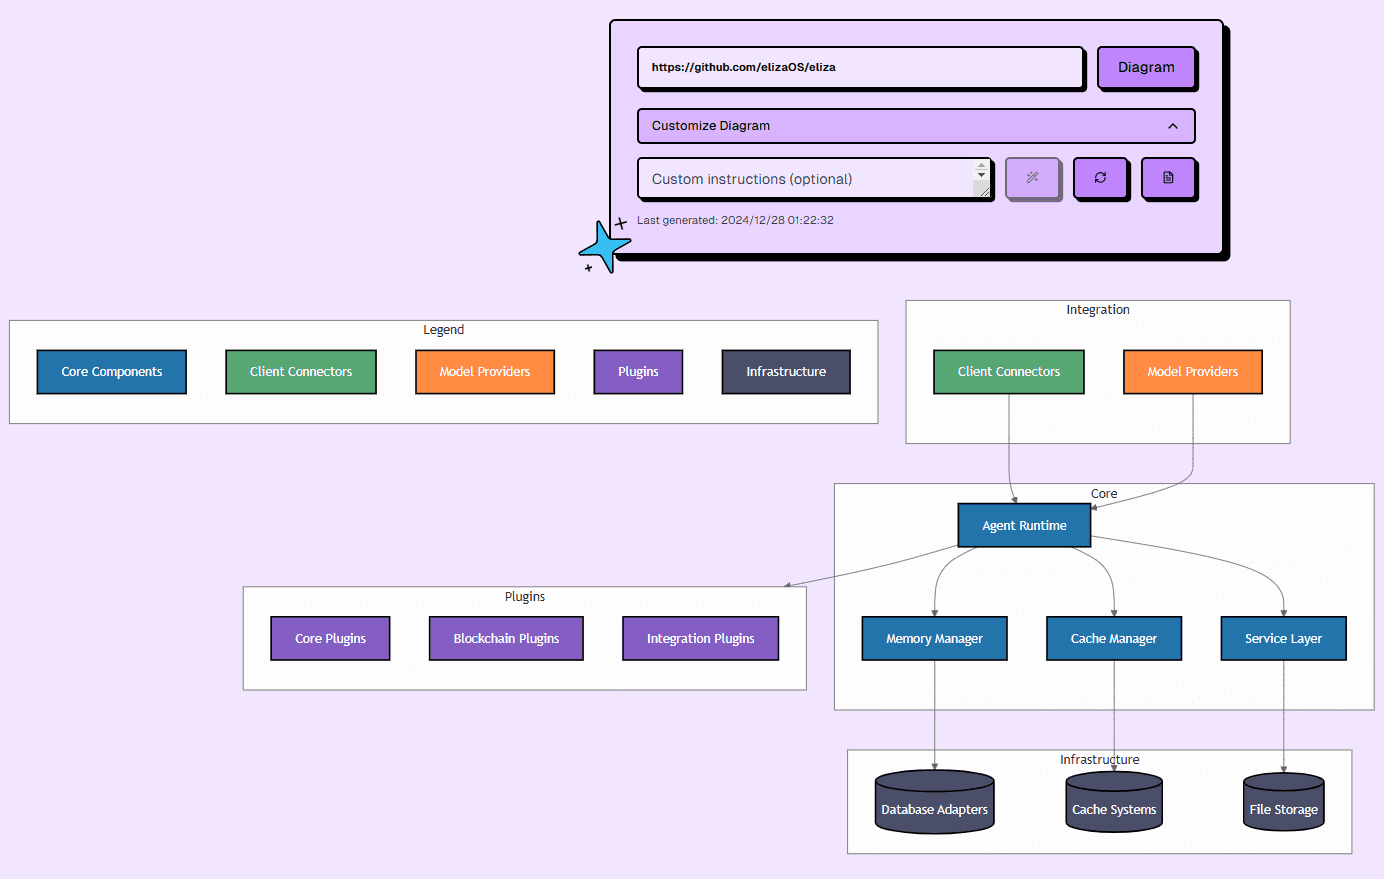
Experience: https://gitdiagram.com/
Function List
- Instant visualization conversion: quickly convert GitHub repository structure to system design/architecture diagrams
- Intelligent Interactive Navigation: Supports direct access to source files and directories by clicking on diagram components
- AI-Driven Generation: Using Claude 3.5 Sonnet to Ensure Speed and Accuracy in Chart Generation
- Customization features: support for modifying and regenerating charts based on user commands
- URL shortcut: Use GitHub URLs by replacing "hub" with "diagram".
- Full API support: Provide public API interface for integration (under development)
- Real-time updates: Support real-time visualization of changes in the code base structure updates
- Customized deployment: provides a complete self-hosted deployment solution
Using Help
Basic usage flow
- Enter the GitHub repository URL or directly use the URL conversion method
- Wait for the system to automatically generate an interactive architecture diagram
- Click on a component in the diagram to navigate directly to the corresponding source code file.
Description of restrictions on use
The current free version has the following usage restrictions:
- Limit 1 chart generation request per minute
- Limit 5 chart generation requests per day
- Optional self-deployment program if you need to break out of your limitations
Self-Hosted Deployment Guide
- environmental preparation
git clone https://github.com/ahmedkhaleel2004/gitdiagram.git cd gitdiagram pnpm i - Configuring Environment Variables
- Copy .env.example to .env
- Configuring Anthropic API Keys
- Optional configuration of GitHub personal access tokens
- Start the back-end service
docker-compose up --build -d- The backend service will run at localhost:8000
- Viewing logs with docker-compose logs -f
- Database settings
chmod +x start-database.sh ./start-database.sh pnpm db:push- The database will run at localhost:5432
- Using pnpm db:studio you can view and manage databases
- Starting front-end services
pnpm dev- Visit localhost:3000 to use the locally deployed version
Advanced Function Use
- customizable command
- The chart generation method can be modified by providing custom commands through the interface
- Support for adapting to the visualization needs of a specific code base structure
- API integration
- Public APIs under development will support third-party system integration
- Codebase visualization that can be automated via APIs
Tips for use
- For large warehouses
- It is recommended to focus first on the structure of the main modules
- Step-by-step drill down to details with interactive navigation
- performance optimization
- Using a self-hosted solution can break the default limitations
- Consider using your own Anthropic API key for better performance
© Copyright notes
Article copyright AI Sharing Circle All, please do not reproduce without permission.
Related articles

No comments...

