Generate all kinds of useful infographics with Cursor/Windsur for free!
Once upon a time sharing a lot of funExamples of card chart prompt wordsThe reason is very simple: the real intention of the user does not match with the sample style of the template. The reason is very simple: these card map prompt word template sample style code is generally fixed, the user's real intent and sample style does not match.
Someone has done a more general adaptation of the cue word:Card Diagram Cue Words: Graphically Display Any Conceptual Schematic with SVG , but the drawbacks are obvious:
- In practice the generated illustrations may deviate significantly from the user's intent, i.e., this cue wordGeneralizability remains weak.
- only if Claude in order to generate relatively complete SVG code.
- Instability when introducing large amounts of context and generating infographics in multiple rounds of dialog.
As it happens:Previously introduced by Chief AI Sharing Circle:It's not the cue words that you have to learn to analyze business data using big models, it's these... , many of my friends don't understand what to do with business model names without learning the cue words.
The answer is:The cue words themselves don't allow you to generate good and useful charts using the big model; it's what kind of charts you're generating and describing them with what you know that counts!
The question is...People don't really understand how to describe in order to generate the right infographic for my simple idea, text document or data document.
Below I'm going to construct a simple set of methods to tryGenerating infographics to fit everyoneRequirement. Sorry, it's possible that the generated infographic doesn't Napkin A nice class of tools, but that's inconsequential compared to the quest for utility. The following formally into the operation of the link...
mounting
Please install Cursor or Windsur, Cursor is recommended here because it can be used with a fewspecial toolspossiblefree of chargeThe
Import Instruction Templates
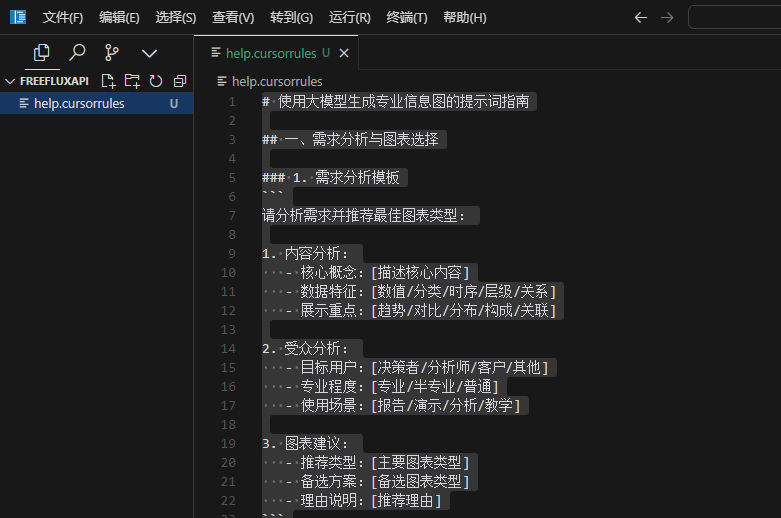
This template is generated from a large model by importing a large number of flowchart examples, and the effective part of the instruction consists of three places: requirements analysis, reference library, and output template. Keep the full template for more inspiration.
# 使用大模型生成专业信息图的提示词指南

## 一、需求分析与图表选择

### 1. 需求分析模板
```
请分析用户提出的需求,猜测用户真实意图并推荐最佳图表类型:

1. 内容分析:
- 核心概念:[描述核心内容]
- 数据特征:[数值/分类/时序/层级/关系/分布/概率]
- 展示重点:[趋势/对比/分布/构成/关联/转化/分群/预测]
- 分析维度:[单维度/二维/多维/时序/空间]
- 模型类型:[描述性/预测性/决策性/分析性]

2. 受众分析:
- 目标用户:[决策者/分析师/客户/其他]
- 专业程度:[专业/半专业/普通]
- 使用场景:[报告/演示/分析/教学]
- 展示方式:[静态展示/简单交互]

3. 技术选型:
- 图表类型:
* 基础图表:[折线/柱状/饼图/散点图]
* 复合图表:[漏斗图/雷达图/树图]
* 分析图表:[矩阵图/热力图/箱线图]
* 结构图表:[流程图/思维导图/组织图]
* 统计图表:[直方图/概率图/回归图]

- 图表库选择:
* 简单流程图 → Mermaid.js
* 基础统计图 → Chart.js
* 商业图表 → ECharts基础版
* 专业分析 → Plotly

- 展示方式:
* 单图展示:突出单一重点
* 多图组合:展示多维关系
* 静态展示:固定数据展示

4. 图表建议:
- 主要图表:[推荐的主图表类型]
- 辅助图表:[补充的图表类型]
- 布局方式:[图表布局建议]
- 配色方案:[配色建议]
```

### 2. 图表类型推荐矩阵

#### a) 商业分析模型图表映射
```
1. 用户行为分析
- AARRR模型 → 漏斗图(多层次渐变色,突出转化过程)
* Acquisition(获取)- 蓝色顶层
* Activation(激活)- 绿色第二层
* Retention(留存)- 黄色第三层
* Revenue(收入)- 橙色第四层
* Referral(推荐)- 红色底层
- RFM模型 → 矩阵热力图
* 横轴:购买频率(F)
* 纵轴:最近购买时间(R)
* 颜色深浅:购买金额(M)
* 客户分群:不同颜色区域
- 聚类分析 → 散点图 + 颜色分组

2. 战略分析
- PEST分析 → 四象限饼图
* Political(政治)- 灰色象限
* Economic(经济)- 橙色象限
* Social(社会)- 蓝色象限
* Technological(技术)- 黄色象限
- 5W2H分析 → 放射状思维导图
* 中心主题 + 7个维度节点
* 使用不同颜色区分各维度
* What/Why/Where/When/Who/How/HowMuch

3. 决策分析
- 决策树模型 → 层级树状图
* 节点表示决策点
* 分支表示可选方案
* 叶子节点表示结果
- 时间序列分析 → 折线图 + 趋势线
* 主曲线展示实际数据
* 虚线表示预测趋势
* 波动区间显示置信度

4. 效果分析
- 帕累托图 → 组合柱线图
* 柱状图表示个体数值
* 折线图表示累计百分比
- 转化漏斗 → S形曲线图
* X轴表示时间/阶段
* Y轴表示转化率
* 曲线形状反映转化特征
```

#### b) 数据特征与图表映射
```
1. 时序数据
- 趋势展示 → 折线图/面积图
- 周期分析 → 环形图/螺旋图
- 累计变化 → 堆叠面积图

2. 分类数据
- 分布对比 → 柱状图/条形图
- 构成分析 → 饼图/环形图
- 层级关系 → 树图/旭日图

3. 关系数据
- 相关性 → 散点图/气泡图
- 网络关系 → 关系图/桑基图
- 层次结构 → 树状图/组织图

4. 地理数据
- 区域分布 → 地图/热力图
- 空间关系 → 路径图/流向图

5. 多维数据
- 属性对比 → 雷达图/平行坐标图
- 矩阵分析 → 热力图/矩阵图
```

### 3. 图表组合模式
```
1. 层次结构模式
- 主图 + 子图
- 概览 + 明细
- 汇总 + 分解

2. 多维度模式
- 时间 + 空间
- 结构 + 趋势
- 分布 + 关系

3. 比较分析模式
- 预期 + 实际
- 同比 + 环比
- 占比 + 排名

4. 因果分析模式
- 原因 + 结果
- 投入 + 产出
- 成本 + 收益
```

## 二、图表生成规范

### 1. 设计原则

```javascript
// 1. 视觉原则
const visualPrinciples = {
hierarchy: {
primary: '核心信息突出',
secondary: '支撑信息层次',
auxiliary: '辅助信息弱化'
},
layout: {
balance: '页面视觉平衡',
whitespace: '留白空间控制'
},
readability: {
contrast: '对比度适中',
spacing: '间距合理',
alignment: '对齐规范'
}
}

// 2. 展示原则
const displayPrinciples = {
clarity: {
title: '标题清晰',
label: '标签可读',
legend: '图例明确'
},
simplicity: {
data: '数据精简',
style: '样式克制',
color: '配色协调'
}
}

// 3. 适配原则
const adaptivePrinciples = {
responsive: {
layout: '基础布局适配',
content: '内容自适应'
},
performance: {
loading: '加载优化',
rendering: '渲染优化'
}
}
```

### 2. 基础配置框架

```javascript
const baseConfig = {
// 1. 布局配置
layout: {
container: {
width: '100%',
maxWidth: '1200px',
padding: '20px',
margin: '0 auto'
},
spacing: {
sm: '8px',
md: '16px',
lg: '24px'
}
},

// 2. 主题配置
theme: {
colors: {
primary: '#primary-color',
secondary: '#secondary-color',
background: '#background-color',
text: '#text-color'
},
typography: {
fontSize: {
sm: '14px',
md: '16px',
lg: '20px'
},
fontWeight: {
regular: 400,
bold: 700
}
}
}
}
```

### 3. 图表生成策略

```javascript
// 1. 数据分析策略
function analyzeDataStrategy(data) {
return {
// 数据特征分析
characteristics: {
type: '数据类型',
scale: '数据规模',
dimensions: '维度数量'
},

// 展示需求分析
requirements: {
purpose: '展示目的',
audience: '目标受众'
}
}
}

// 2. 图表选择策略
function selectChartStrategy(analysis) {
return {
// 图表类型选择
chartType: {
primary: '主要图表类型',
secondary: '辅助图表类型'
},

// 布局方案
layout: {
structure: '整体结构',
arrangement: '元素排列'
}
}
}

// 3. 样式映射策略
function styleMapStrategy(chartConfig) {
return {
// 视觉编码
visual: {
color: '颜色方案',
shape: '形状系统'
},

// 响应式规则
responsive: {
layout: '基础布局'
}
}
}
```

### 4. 适配方案

```javascript
const adaptiveStrategy = {
// 1. 场景适配
scenario: {
presentation: {
style: '演示风格'
},
analysis: {
depth: '分析深度'
}
},

// 2. 设备适配
device: {
desktop: {
layout: '桌面布局'
},
mobile: {
layout: '移动布局'
}
}
}
```

## 三、输出规范

### 1. HTML基础模板
```html
<!DOCTYPE html>
<html lang="zh">
<head>
<meta charset="UTF-8">
<meta name="viewport" content="width=device-width, initial-scale=1.0">
<title>${TITLE}</title>
<script src="${CHART_LIB_URL}"></script>
</head>
<body>
<div class="chart-container">
<h1 class="chart-title">${TITLE}</h1>
<div id="chart"></div>
</div>
</body>
</html>
```

### 2. 变量说明
```javascript
// 1. 基础变量
const templateVars = {
// 1.1 图表库导入
CHART_LIB_IMPORTS: {
echarts: '<script src="https://cdn.jsdelivr.net/npm/echarts@latest"></script>',
d3: '<script src="https://cdn.jsdelivr.net/npm/d3@latest"></script>',
chartjs: '<script src="https://cdn.jsdelivr.net/npm/chart.js"></script>',
mermaid: '<script src="https://cdn.jsdelivr.net/npm/mermaid@latest/dist/mermaid.min.js"></script>'
},

// 1.2 容器结构
CHART_CONTAINER: {
basic: '<div id="${CHART_ID}"></div>',
withWrapper: `
<div class="chart-wrapper">
<div id="${CHART_ID}"></div>
</div>
`,
withHeader: `
<div class="chart-wrapper">
<header>
<h1>${TITLE}</h1>
<div class="description">${DESCRIPTION}</div>
</header>
<div id="${CHART_ID}"></div>
</div>
`
},

// 1.3 样式变量
STYLE_VARS: {
colors: ['#5470c6', '#91cc75', '#fac858', '#ee6666'],
fonts: 'system-ui, -apple-system, "Microsoft YaHei", sans-serif',
sizes: {
mobile: '100%',
tablet: '90%',
desktop: '1200px'
}
}
};

// 2. 图表初始化脚本模板
const chartInitTemplates = {
// 2.1 基础初始化
basic: `
document.addEventListener('DOMContentLoaded', function() {
${CHART_INIT_CODE}
});
`,

// 2.2 带错误处理
withErrorHandling: `
document.addEventListener('DOMContentLoaded', function() {
try {
${CHART_INIT_CODE}
} catch (error) {
console.error('图表渲染失败:', error);
${ERROR_HANDLING_CODE}
}
});
`,

// 2.3 带响应式支持
withResponsive: `
document.addEventListener('DOMContentLoaded', function() {
try {
${CHART_INIT_CODE}
window.addEventListener('resize', function() {
${RESIZE_HANDLING_CODE}
});
} catch (error) {
console.error('图表渲染失败:', error);
${ERROR_HANDLING_CODE}
}
});
`
};

// 3. 样式模板
const styleTemplates = {
// 3.1 基础样式
basic: `
body { margin: 0; padding: 15px; }
#${CHART_ID} { width: 100%; height: ${HEIGHT}px; }
`,

// 3.2 响应式样式
responsive: `
@media screen and (max-width: 768px) {
${MOBILE_STYLES}
}
@media screen and (min-width: 769px) and (max-width: 1024px) {
${TABLET_STYLES}
}
@media screen and (min-width: 1025px) {
${DESKTOP_STYLES}
}
`
};
```

### 3. 使用说明
```javascript
// 1. 基础用法
const basicUsage = {
// 1.1 选择图表库
selectLib(chartType) {
return templateVars.CHART_LIB_IMPORTS[chartType];
},

// 1.2 选择容器
selectContainer(type, params) {
return templateVars.CHART_CONTAINER[type]
.replace('${CHART_ID}', params.chartId)
.replace('${TITLE}', params.title)
.replace('${DESCRIPTION}', params.description);
},

// 1.3 选择初始化模板
selectInitTemplate(type) {
return chartInitTemplates[type];
}
};

// 2. 扩展用法
const extendedUsage = {
// 2.1 自定义样式
customStyle: `
${styleTemplates.basic}
${styleTemplates.responsive}
${CUSTOM_STYLES}
`,

// 2.2 自定义交互
customInteraction: `
${INTERACTION_CODE}
`
};
```

# 约束
- 请严格按照上述规范和模板进行代码生成,确保输出HTML文件结果符合预期。
Using Cursor as an example, create a help.cursorrules file, then copy and paste the above prompt words and save.
utilization
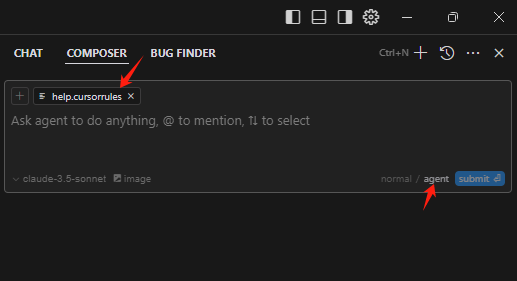
Correctly referencing the prompt description file and turning on agent mode
1. Context-free generation of infographics
utilization Business Data Analytics with Big Models In the method to generate "RFM model", RFM model is very representative, as a reasonable presentation of the infographic should be more three-dimensional, to reflect the relationship between the R, F, M three. The first attempt without target:
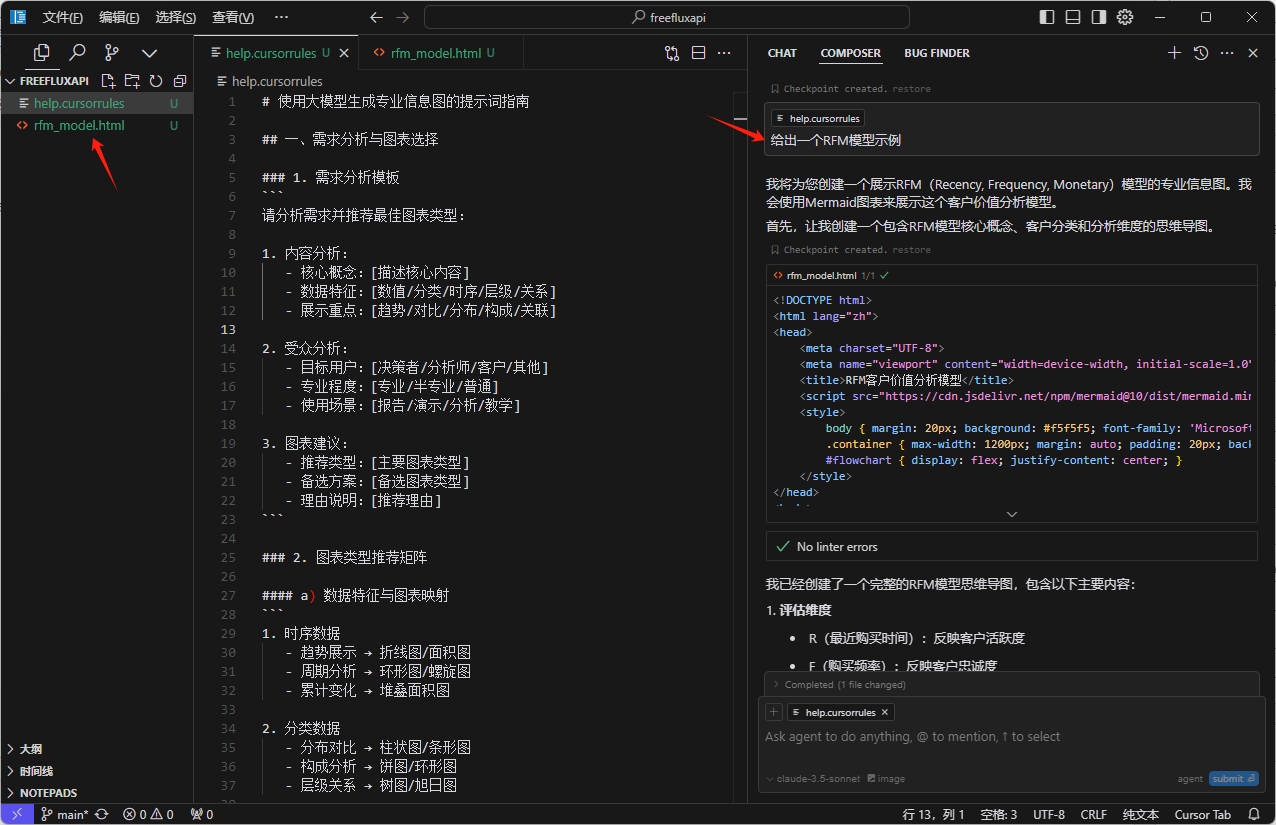
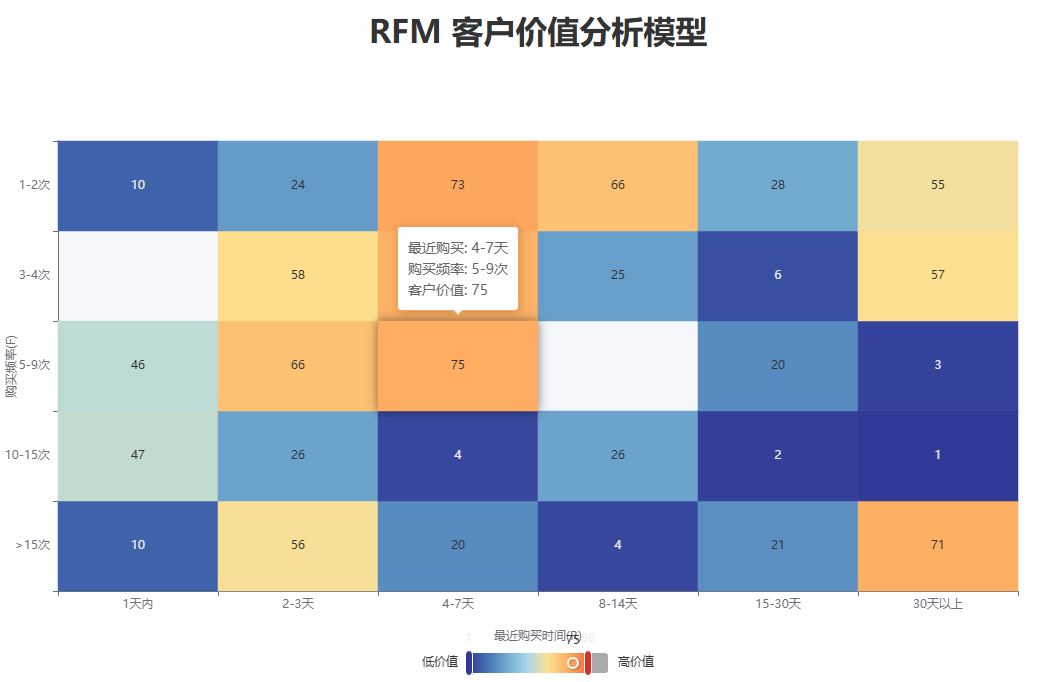
Since my request was to generate "examples", it was more oriented towards demonstrating the core concepts, and did not construct the analytical diagrams that we had envisioned, which was also a problem during the Agent's thinking phase. We could have interrupted the Agent's train of thought and asked for another method of generation, which I did not do.
By this step the advantages of the program have been demonstrated, the same process is difficult to do with other tools and models, and the end point of generating infographics should be to reference rich libraries.
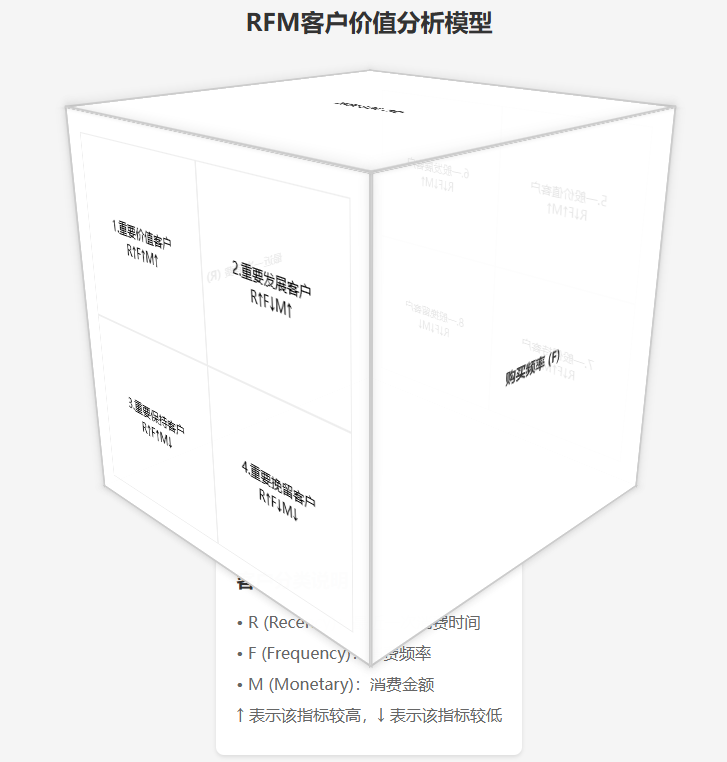
Next, I uploaded a 3D RFM illustration and asked for it to be generated according to my image:
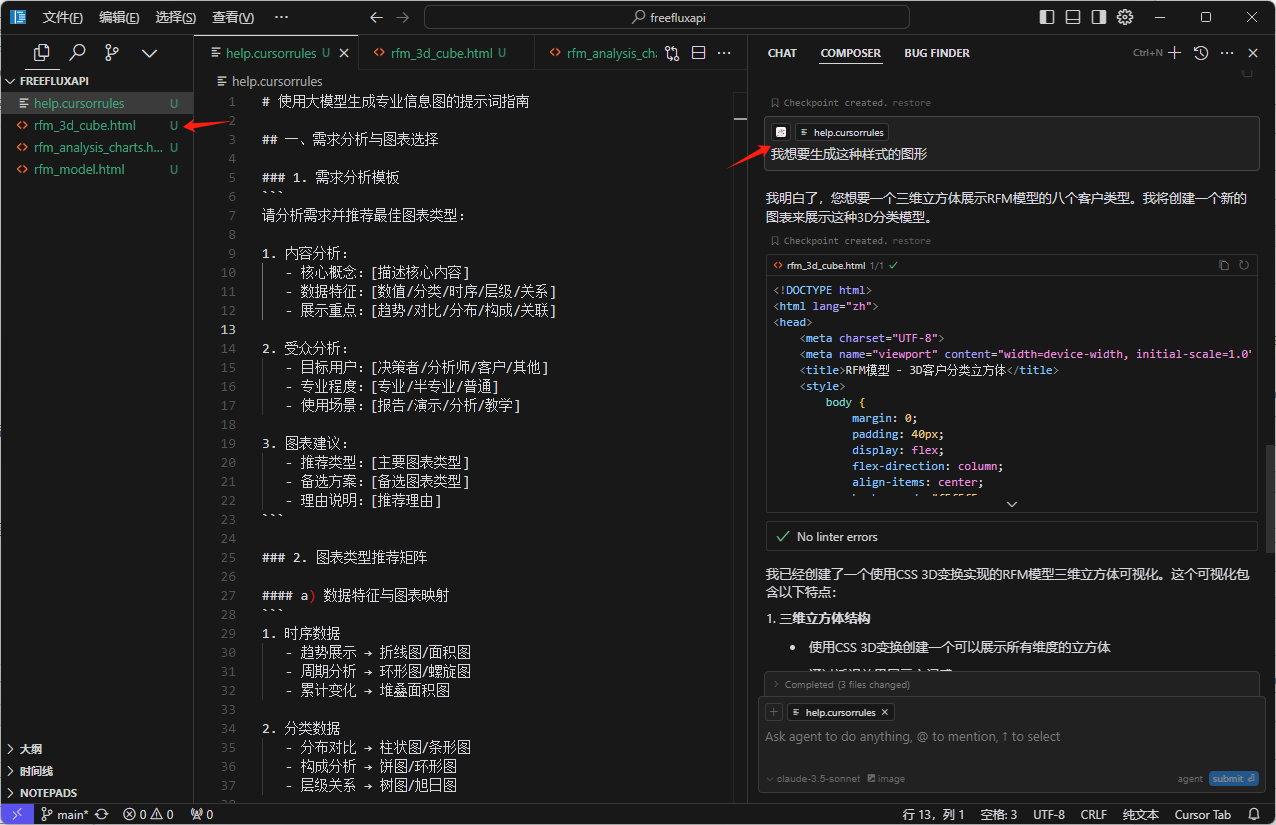
This time, by the way, the style overlap issue can be requested again for modification, and no further optimization will be done here.
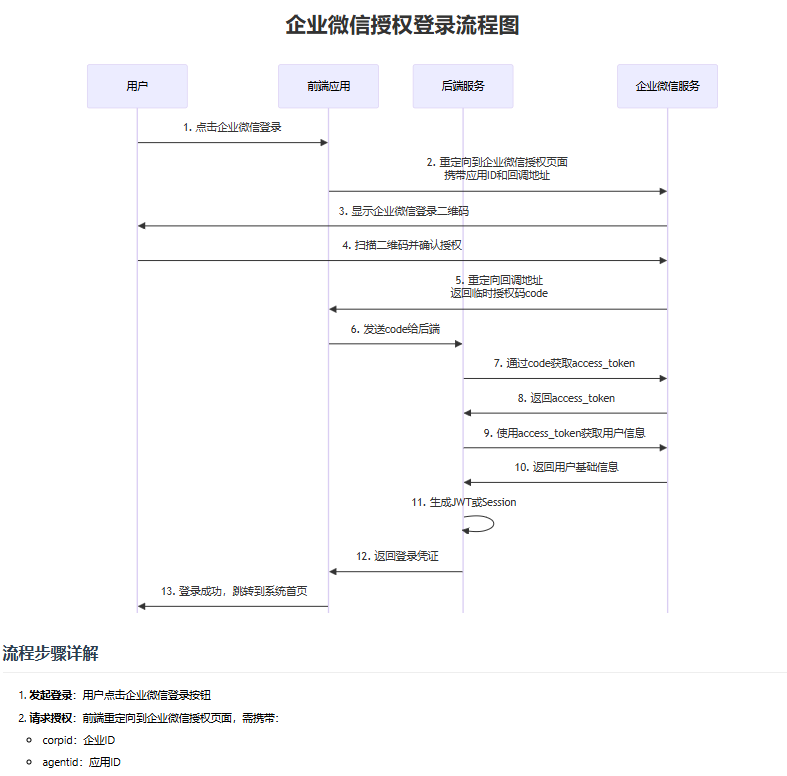
Change a task: do not show the operation process here, just look at the effect, the instruction is: to generate a flowchart of the enterprise WeChat authorization login for technical development.
2. Contextualized generation of infographics
analog Napkin You can import articles to generate infographics, but you can use this program to generate multiple infographics based on different content in the article, a simple demo: (clear the previous dialog records and generated images before the demo)
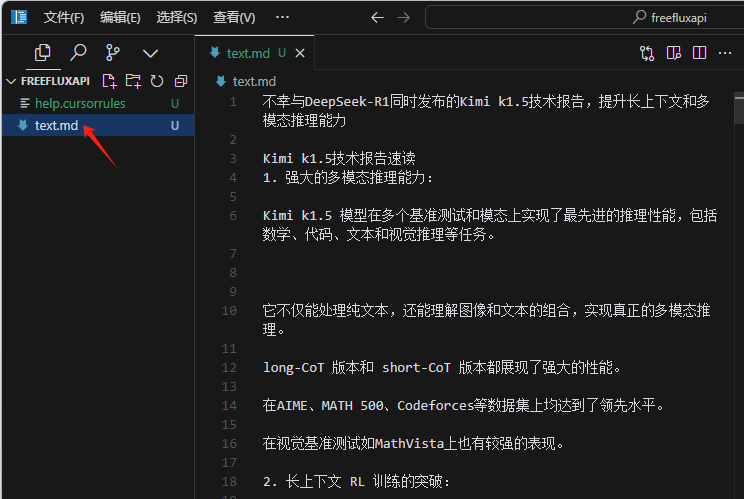
First upload a long article and save it as text.md:
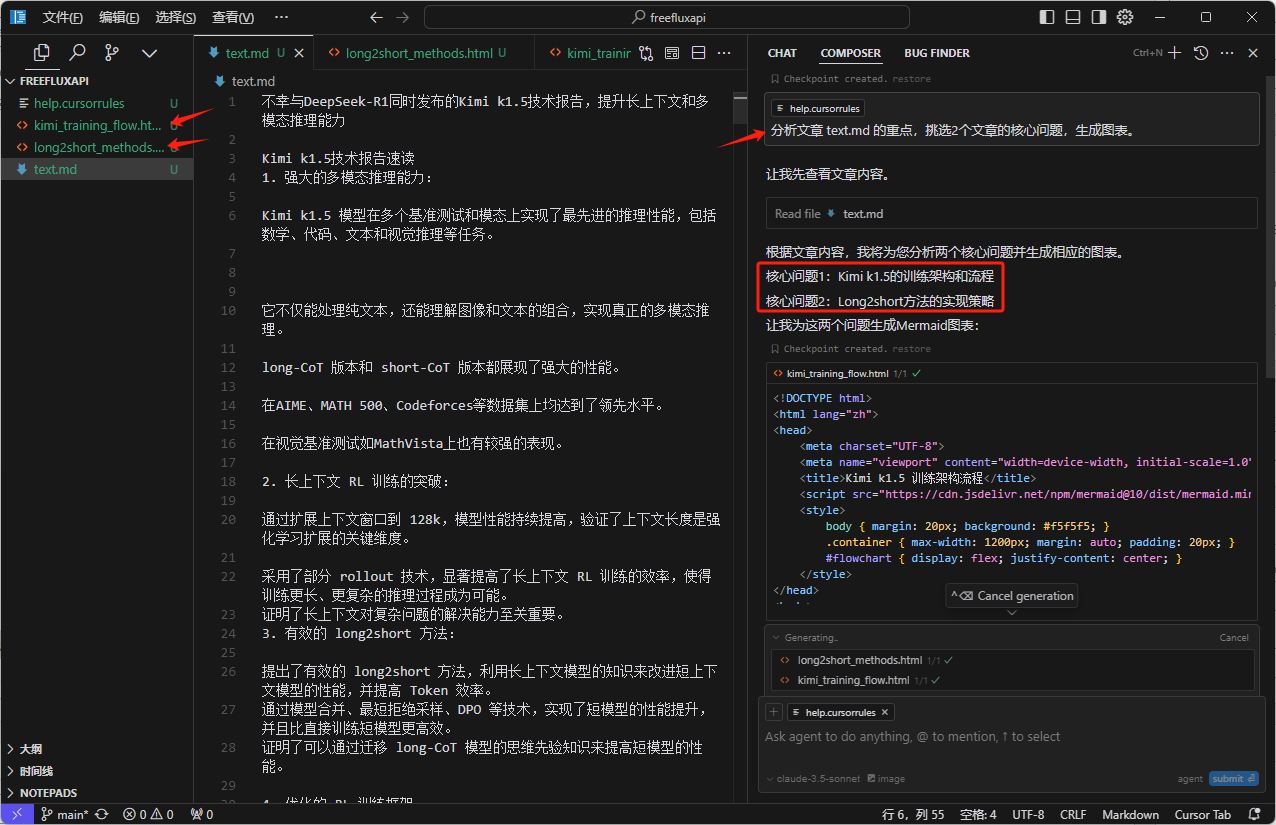
Input instructions: analyze the focus of the article text.md, pick 2 core issues of the article and generate a chart. (still requires free play for large models)
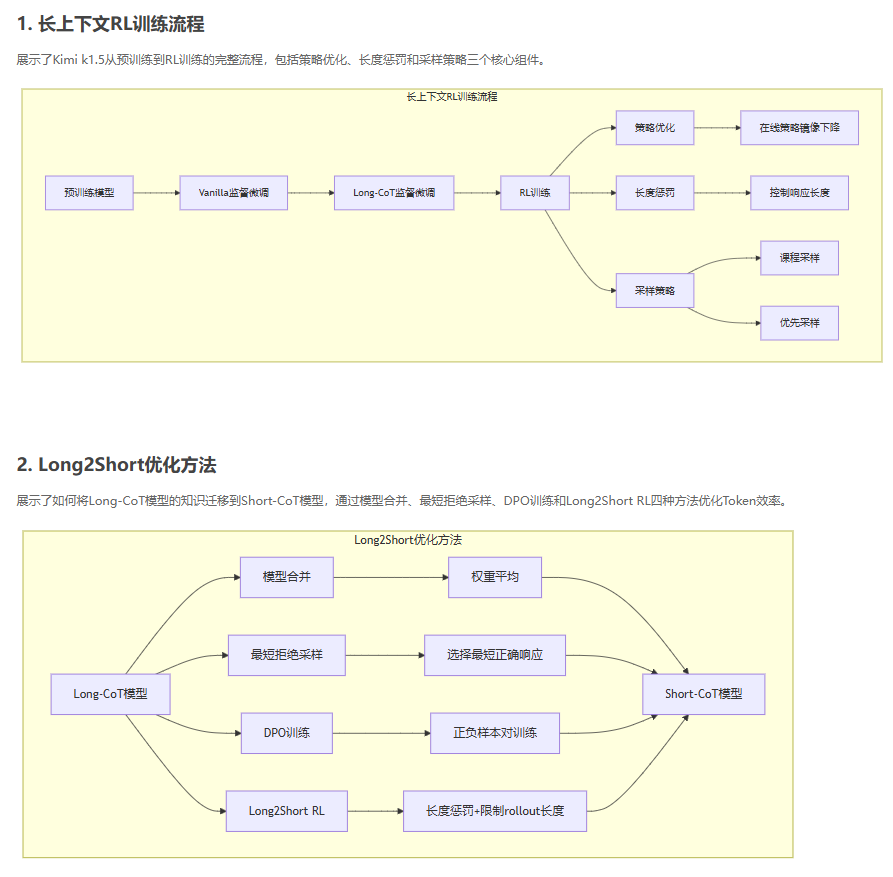
This time the flowchart was generated, and there are disadvantages, the article is too long, the content itself describes the logic of the problem, only humans can refine the complete flowchart by guessing, and it is understandable that the big model naturally can't generate a very well-designed diagram.
The last example lets us enter a set of data and mix in some financial content to see how well it presents the data analysis:
PS: Our goal is not data analysis, but visual presentation of the results of data analysis. In fact, from analyzing a large amount of data to displaying the information, relying on the Agent's task planning capability, it can actually be done in one step (e.g., introducing a data analyzing MCP services), this issue is not discussed in depth.
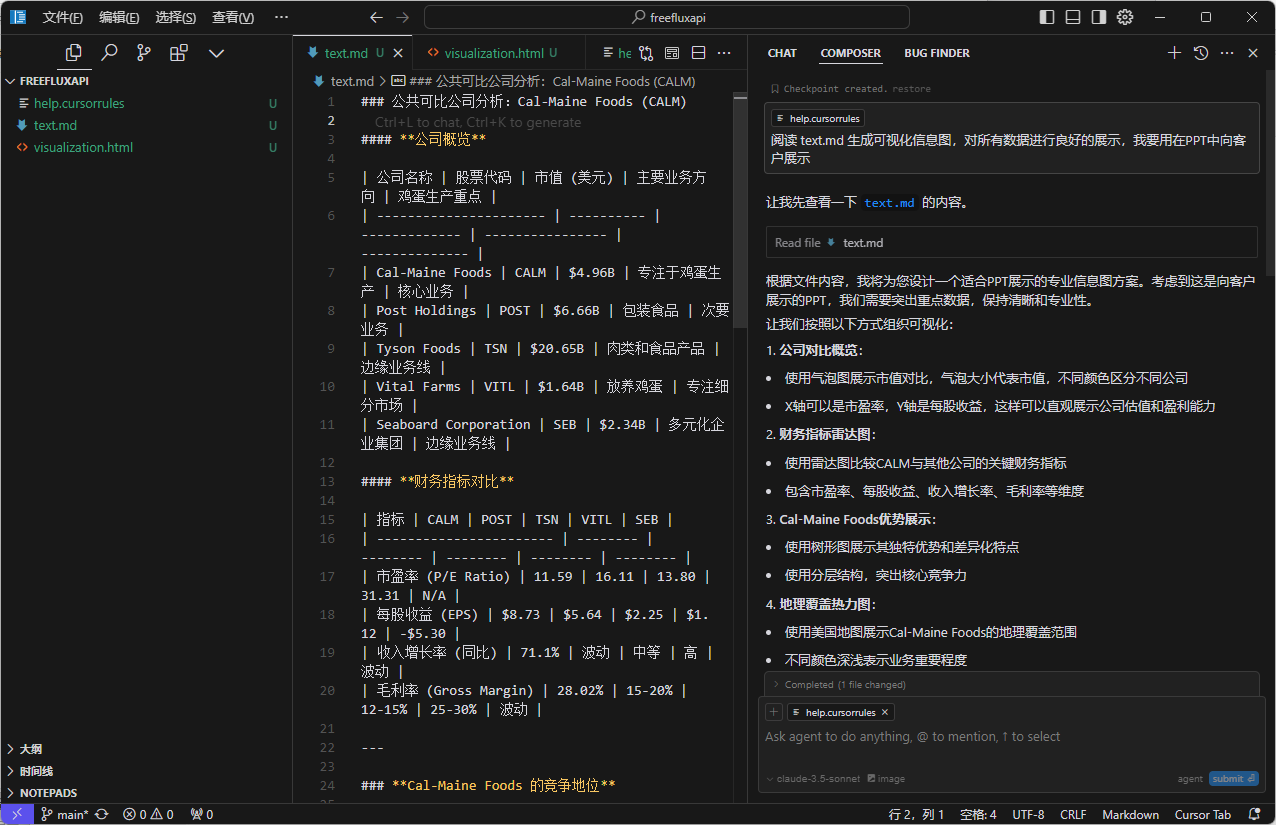
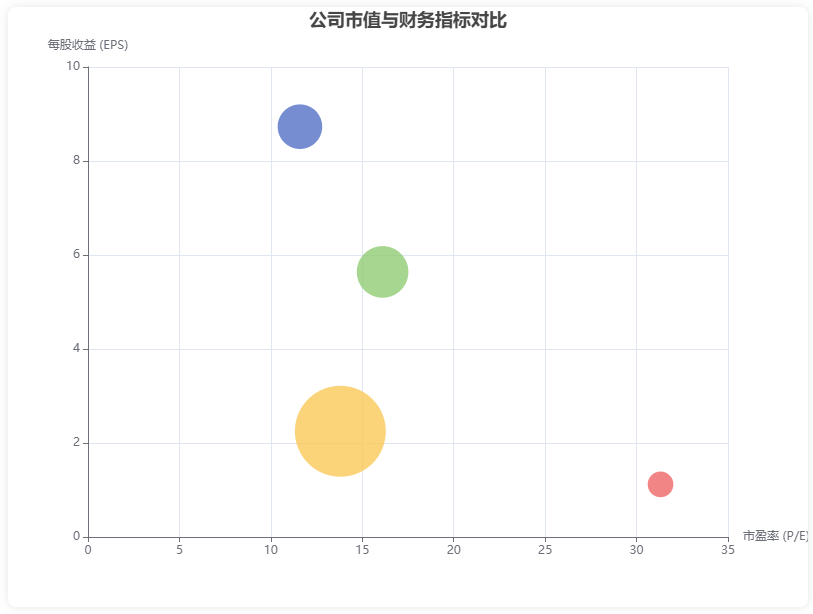
Three charts were generated:
1. Company Overview
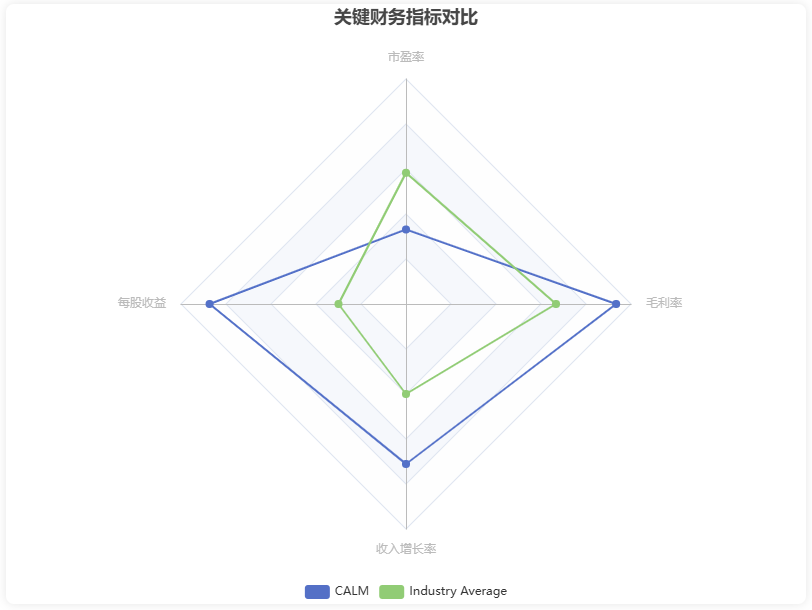
2. Financial comparison
3. Competitive advantage
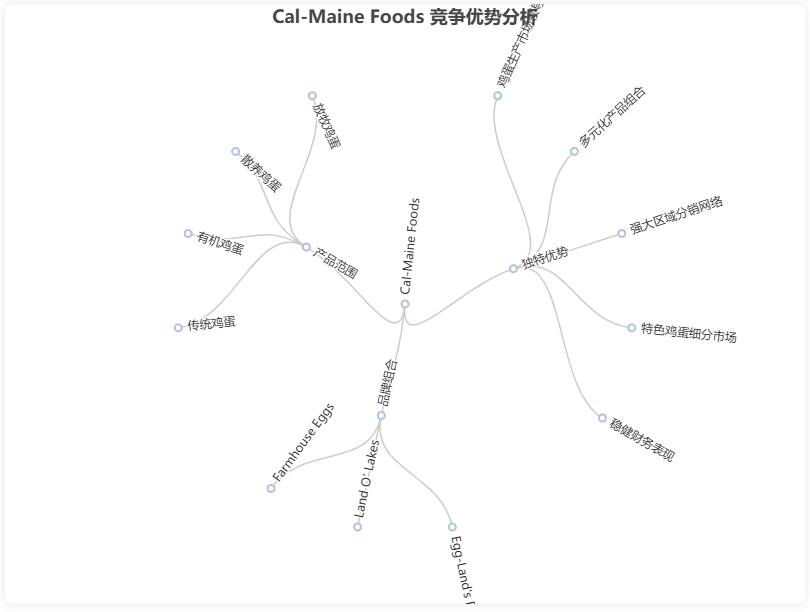
ultimate
Each of these AI IDEs can call "tools", typically the Cline The MCP is referenced in the command. On top of the existing prompts, if you want to analyze the in-depth data before displaying the charts, you can ask cursor to deploy a python environment and then create an analysis script for the example data you gave, and then give a statement at the end of the command template: When analyzing the data, please try to execute the XXX.py script. The possibilities are endless!
© Copyright notes
Article copyright AI Sharing Circle All, please do not reproduce without permission.
Related articles

No comments...

