GraphRAG Visualizer: a tool for visualizing and exploring Microsoft GraphRAG artifacts
General Introduction
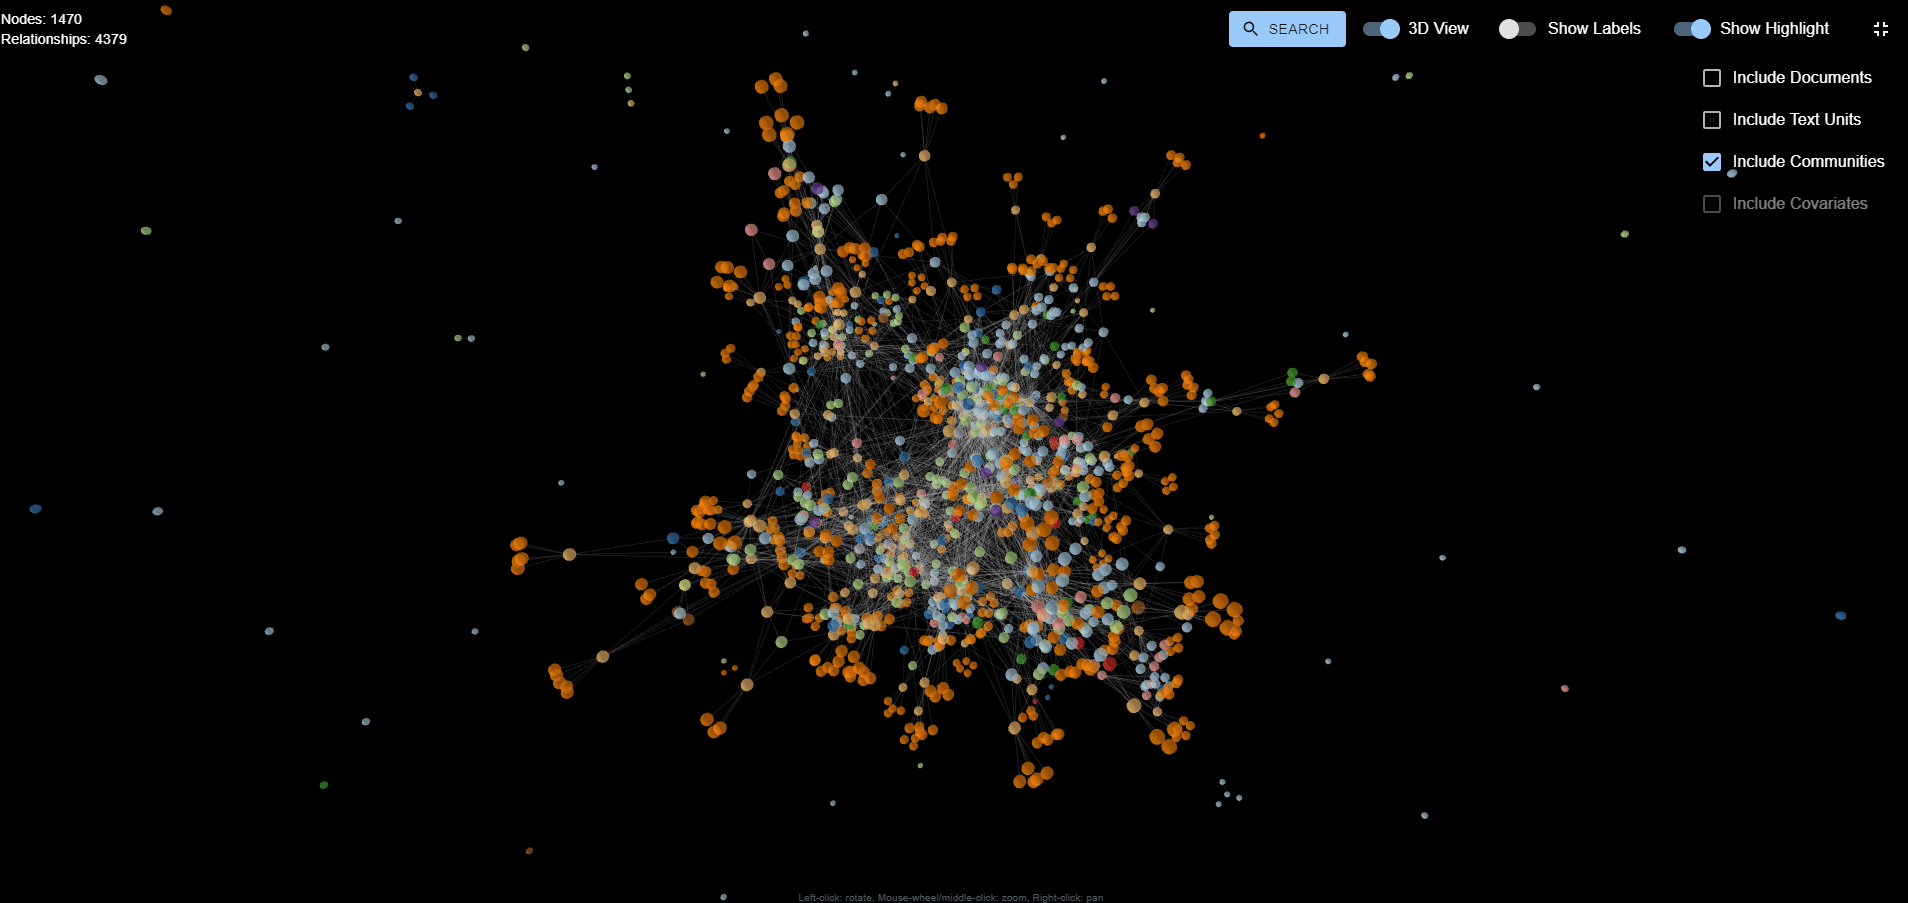
GraphRAG Visualizer is a web-based tool designed to help users visualize and explore artifacts from Microsoft GraphRAG. By uploading Parquet files generated by the GraphRAG indexing pipeline, users can easily view and analyze data without additional software or scripting. The tool supports 2D and 3D graph visualization, data table display, and search capabilities, and all data processing is performed locally to ensure data security and privacy.


Function List
- graphical visualization: View 2D or 3D graphics in the Graphics Visualization tab.
- data sheet: Displays the data in the Parquet file in the Data Tables tab.
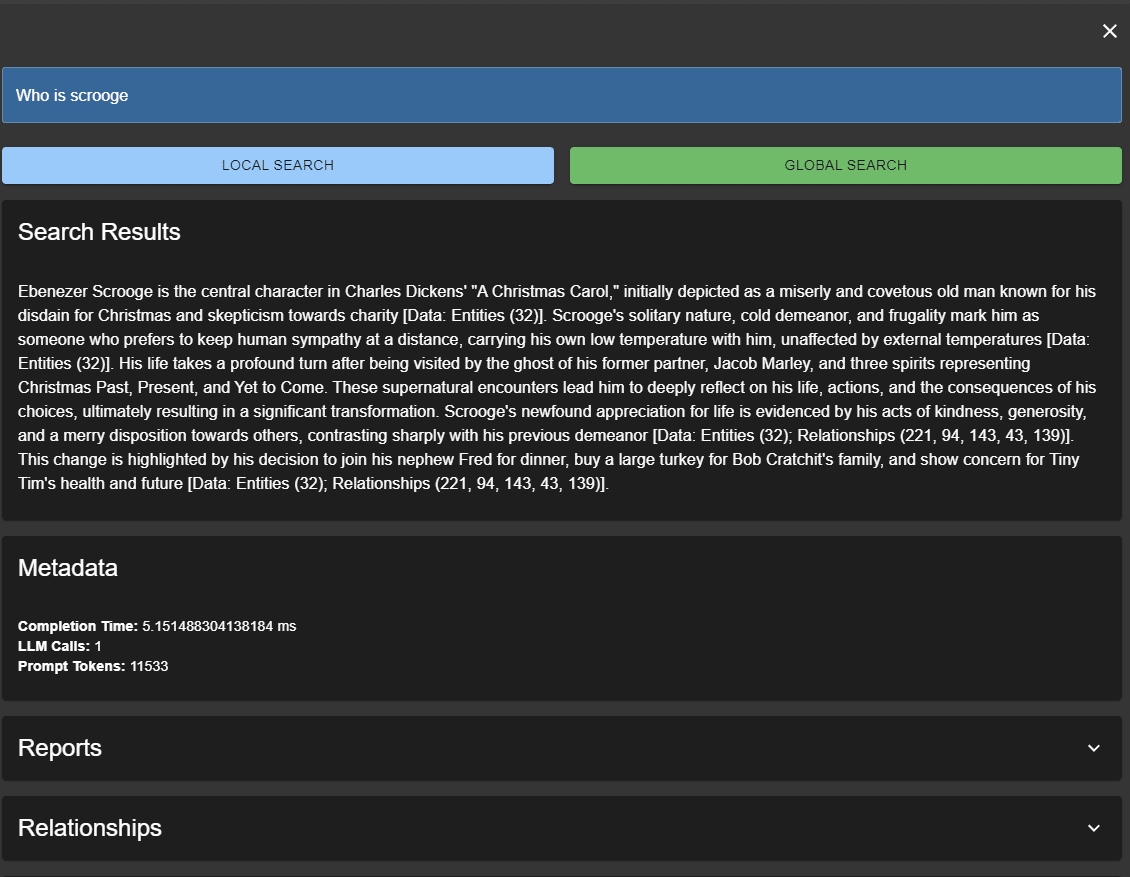
- search function: Supports search, allowing users to focus on specific nodes or relationships.
- local processing: All artifacts are processed on a local computer to ensure data security and privacy.
Using Help
Installation process
- clone warehouse: Clone the repository to the local computer.
   git clone https://github.com/noworneverev/graphrag-visualizer.git
cd graphrag-visualizer
- Installation of dependencies: Install the necessary dependencies.
npm install
- Running the development server: Start the development server.
npm start
- Open the application: Open the application in the browser.
http://localhost:3000
Usage Process
- Loading Parquet Files: Place the Parquet file in the
public/artifactsdirectory, and these files are automatically loaded when the application starts.- Example of file organization:
public/artifacts/create_final_entities.parquetpublic/artifacts/create_final_relationships.parquetpublic/artifacts/create_final_documents.parquetpublic/artifacts/create_final_text_units.parquetpublic/artifacts/create_final_communities.parquetpublic/artifacts/create_final_community_reports.parquetpublic/artifacts/create_final_covariates.parquet
- Example of file organization:
- Using the graphical visualization function: View 2D or 3D graphs in the Graph Visualization tab to explore data nodes and relationships.
- Using the Datasheet Function: View and analyze the data in the Parquet file in the Data Tables tab.
- Using the search function: Easily search and explore data on local servers by querying API servers through the search interface.
Detailed Operation Procedure
- graphical visualization: Select the Graph Visualization tab and use the mouse to drag and zoom to view the graph. Click on a node to view details.
- data sheet: Select the Data Tables tab to browse and filter the data. Click on the column headings to sort.
- search function: Enter the search criteria in the search field and click the search button to view the search results.
Through the above steps, users can fully master the use of GraphRAG Visualizer and easily visualize and analyze data.
© Copyright notes
Article copyright AI Sharing Circle All, please do not reproduce without permission.
Related posts

No comments...


