EzyGraph: an AI visual graphic generator that uses AI to convert blog posts into beautiful infographics
General Introduction
EzyGraph is an AI-based tool designed to quickly convert blog posts into visually appealing infographics. With easy-to-use operations, users can transform complex text content into easy-to-understand graphs that enhance readability and user engagement.EzyGraph is especially suited for content creators and marketers to efficiently create professional-looking graphs without the need for design skills, significantly saving time and effort.
together with Napkin Functionality differences: EzyGraph operations start by selecting a template; Napkin operations start by entering content without selecting a template.
Function List
- AI article to graphic: automate blog posts and convert complex data into easy-to-understand infographics
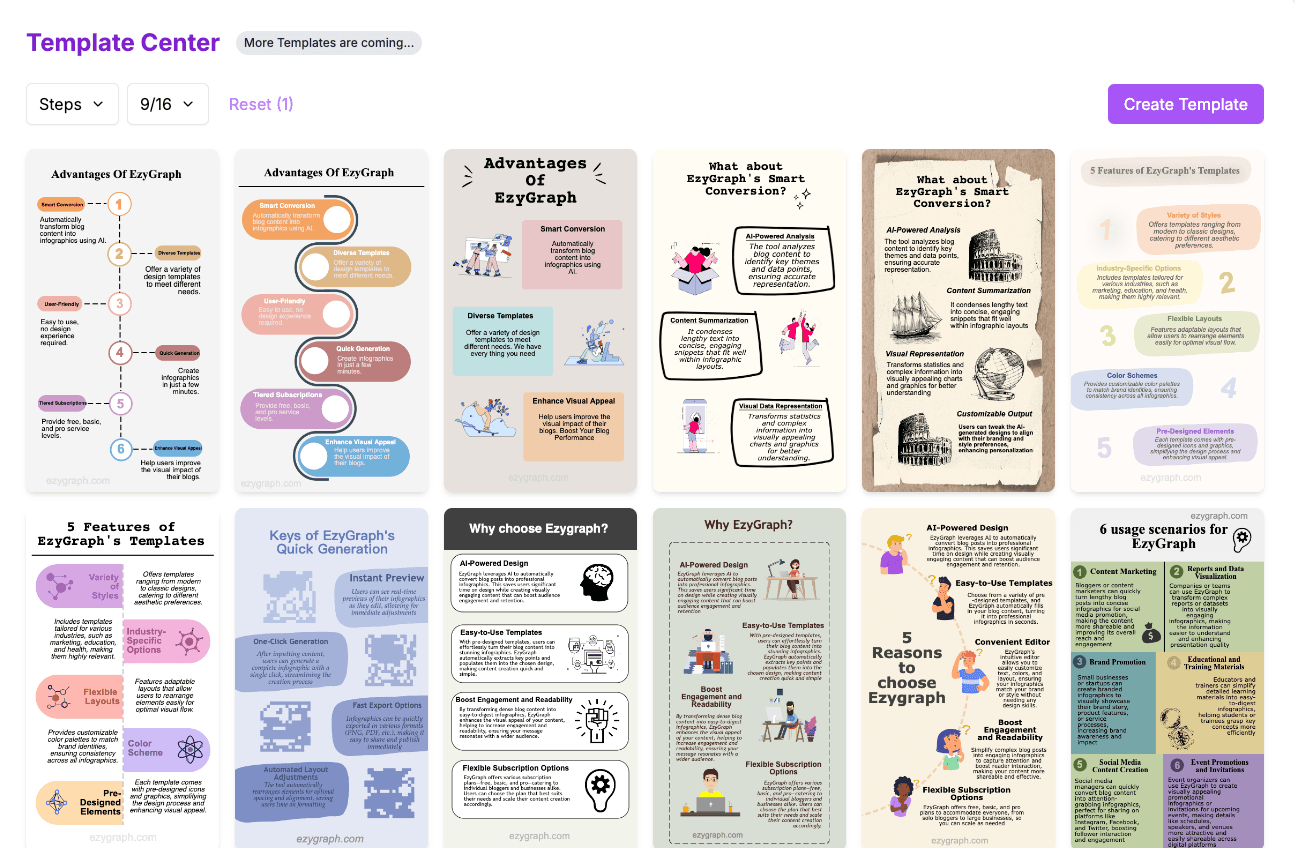
- template library: A variety of customizable chart templates are available, allowing users to customize their designs.
- Efficient conversion: Generate high-quality charts quickly
- Customized watermarks: Support for adding customized watermarks
- High quality export: Support for exporting high-resolution charts
Using Help
Function Operation Guide
- Uploading Blog Posts::
- Visit the official EzyGraph website and log in to your account.
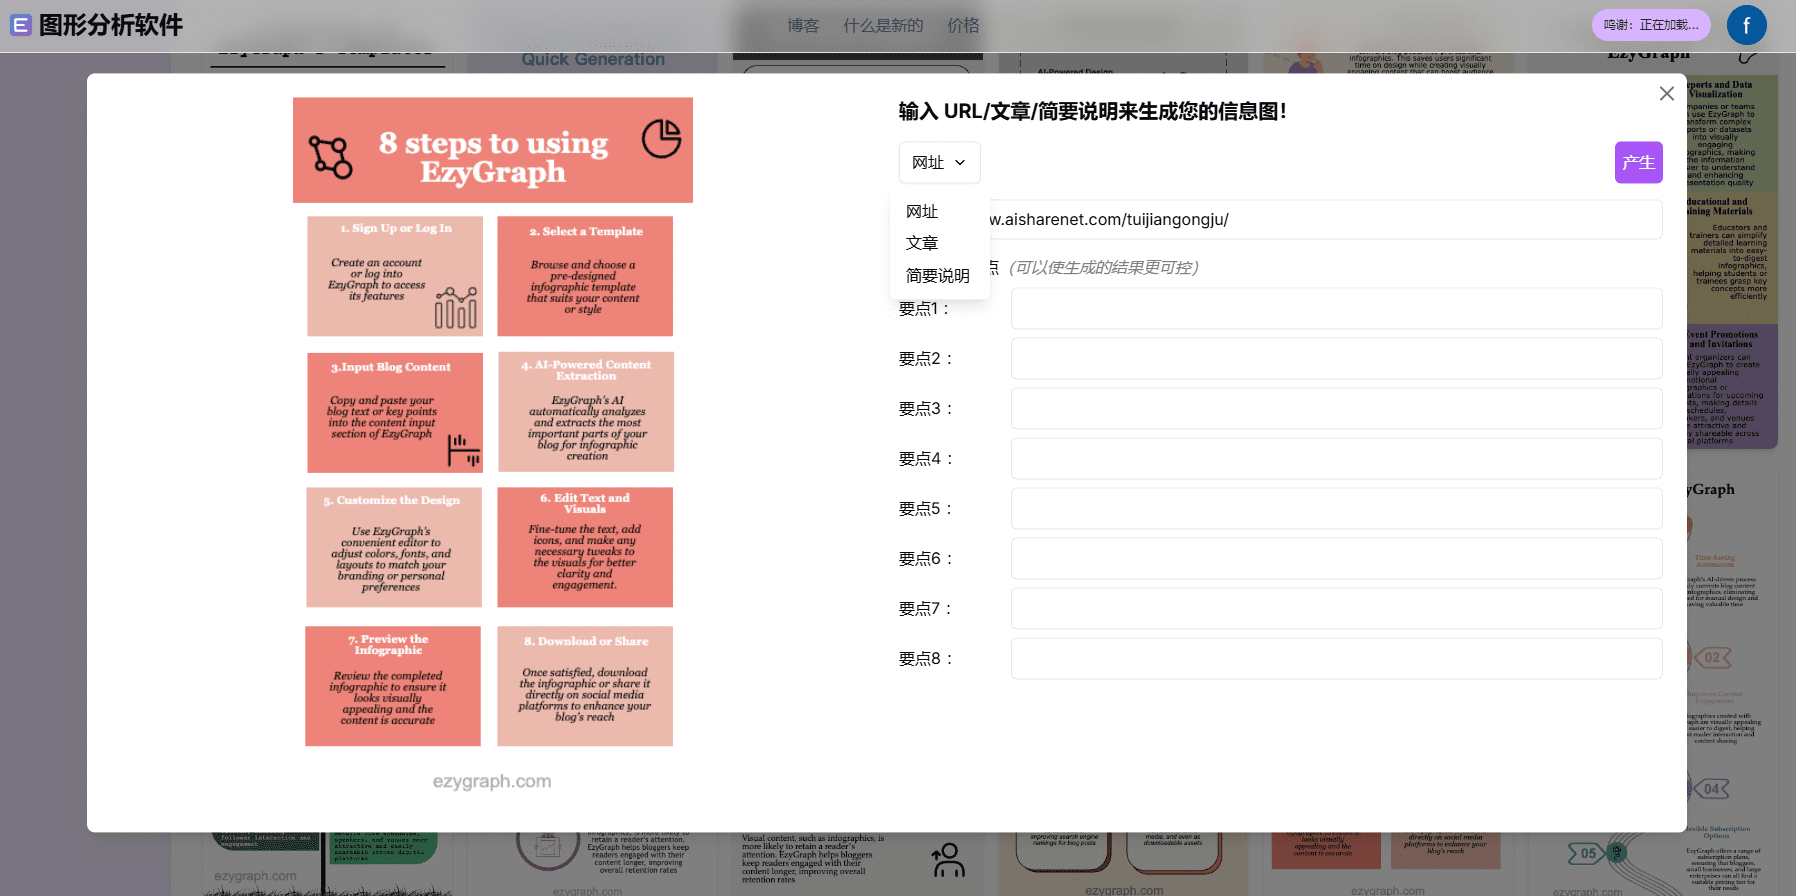
- Click the "Upload Blog" button on the homepage, you can choose to paste the URL of the blog post or upload the text content directly.
- AI auto-generated charts::
- After uploading the article, click the "Generate Graph" button and EzyGraph's AI engine will automatically analyze the article content and generate an infographic.
- Select a template::
- After the system generates the chart, the user can select the appropriate template from the template library for application.
- The template library offers a variety of styles and layouts so that users can choose the most suitable template according to their needs.
- Custom Editing::
- Users can further customize the chart using the editing tools provided by EzyGraph.
- Support for modifying colors, fonts, chart elements, etc. to ensure that the chart matches your personal or brand style.
- Add Watermark::
- In the chart editing interface, users have the option to add a custom watermark to protect original content.
- Export & Share::
- After editing, click the "Export" button and select the desired resolution and format (e.g. PNG, JPEG, etc.) to download.
- Users can also share the charts directly to social media platforms such as Twitter, LinkedIn, etc. to boost article exposure and user interaction.
Hints and Tips
- Choosing the right template: Enhance the visual impact of your charts by choosing the template that best highlights the key points based on the content of the article.
- Keep it simple.: Infographics should be as concise as possible, avoiding excessive text and complex graphical elements.
- regular update: Keep your content fresh and engaging by regularly updating the graphs of your blog posts with EzyGraph.
With the above steps, users can easily create professional infographics to enhance readability and user engagement of blog posts.EzyGraph's AI technology and user-friendly interface make chart creation easier and more efficient than ever.
common problems
- How does EzyGraph work? EzyGraph uses AI technology to analyze blog content and automatically generate infographics that users can further edit and embellish.
- Is it possible to customize the generated infographic? Yes, users can customize the generated infographics using EzyGraph's editor.
- What file formats are supported for export? EzyGraph supports exporting high quality PNG and JPEG image files.
- Is there a limit to the number of infographics that can be generated? Depending on the subscription plan, users can generate a certain number of infographics per month, please refer to the pricing page on the official website for more details.
© Copyright notes
Article copyright AI Sharing Circle All, please do not reproduce without permission.
Related posts

No comments...

