Love Chart - AI data visualization platform, AI automatically recommend chart types
What's the love chart?
Love Chart is an intelligent data visualization platform launched by Dysprosium Technology. Based on AI technology, the platform automatically recommends appropriate chart types based on data characteristics and generates beautiful chart styles. The platform supports bar charts, line charts, pie charts and other chart types, and provides rich templates for users to customize. Support users to import data from Excel, CSV, database and other data sources, the system automatically recognizes the processing format, the generated chart can be exported to JPEG, PNG, PDF and other formats. Love Chart has AI text generation, image generation and data analysis functions, based on a simple and clear interface, users can easily transform data into intuitive and easy to understand visualization content, applicable to business reports, social media, academic research and other scenarios, to help users efficiently display and analyze data.
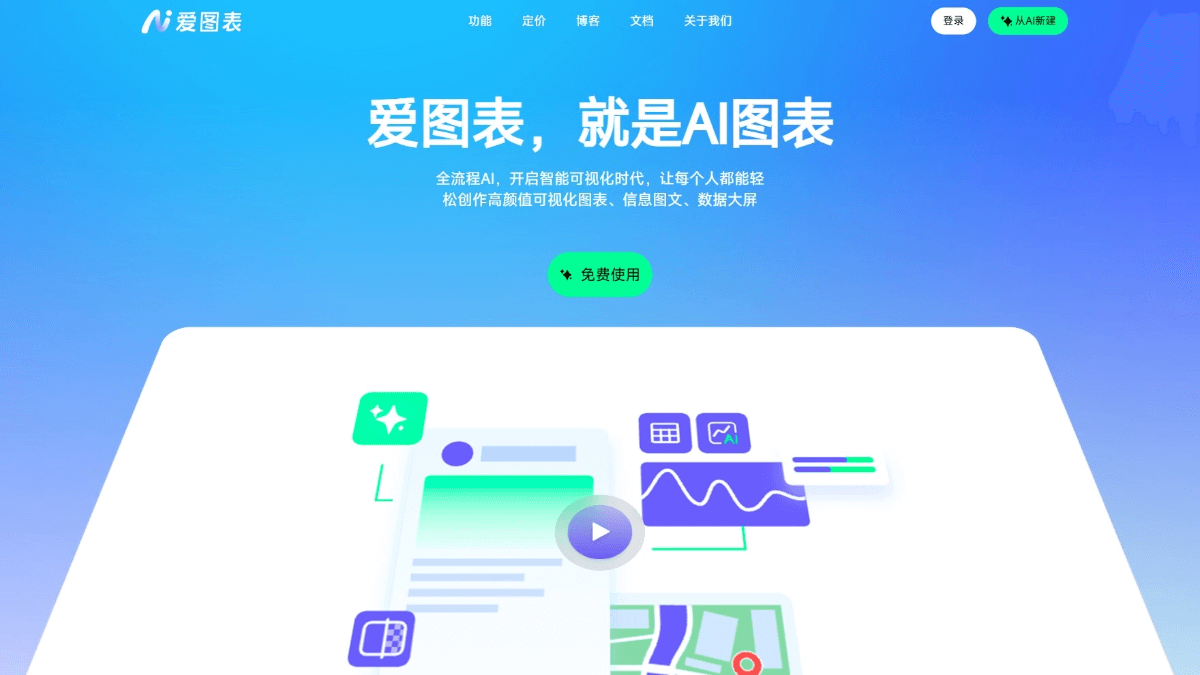
Key Features of Love Charts
- Intelligent Chart Generation: Based on AI technology, it automatically recommends appropriate chart types based on data characteristics and generates beautiful styles, so that users don't need to manually select chart types, saving time and effort.
- Multiple chart typesProvide bar charts, line charts, pie charts, radar charts and other chart types to meet different data display needs and adapt to various scenarios and analysis purposes.
- Multiple Data Source Support: Support importing data from various data sources such as Excel, CSV, database, etc. The system automatically recognizes and handles the data format to simplify the data import process and improve work efficiency.
- Multi-format exportThe generated charts support exporting to JPEG, PNG, PDF and other mainstream formats, which is convenient to use in different scenarios, such as reports, web pages, presentations and so on.
- AI text generation: Access to the DeepSeek series of AI models to achieve intelligent text continuation, multi-language translation and specialized touch-ups to help users optimize the copy in the charts and make the text clearer, more accurate and more professional.
- AI image generationIt provides unlimited generation of massive materials, together with professional functions such as intelligent keying and lossless zoom, to help users deal with the material images needed for charts and improve the visual effect of charts.
- AI data analysis: Intelligent analysis of imported data, providing multi-dimensional analysis such as data trends, data comparison, correlation analysis, distribution analysis, etc. It supports the generation of text reports to help users quickly understand the meaning behind the data and improve the efficiency of data analysis.
- Intuitive User InterfaceProviding a simple and clear interface, users can quickly generate high-quality charts based on drag-and-drop operations, lowering the threshold of use and making data visualization easy to use.
The official website of Love Charts
- Official website address:: https://aitubiao.com/
How to use Love Charts
- Register & Login: Visit the official website of Love Chart: https://aitubiao.com/ and complete the registration and login by filling in the relevant information as required.
- Data importAfter logging in, select "Create from AI" or "New Project". Support importing data from Excel, CSV file, or directly from database.
- Generate Charts: Select the required data columns, Love Chart automatically recommend the appropriate chart type according to the data characteristics. Click Generate Chart, the system quickly generate charts, providing a variety of styles and templates to choose from.
- Custom Charts: Based on the generated chart, adjust the color, font, layout and other options to personalize the chart.
- Text and Image Processing: Based on AI text generation function, continue, summarize, optimize or translate the text in the chart. Based on the AI image generation function, generate image materials according to requirements, or process existing images.
- data analysis: Love Charts automatically analyzes imported data, providing multi-dimensional analysis results such as trends, comparisons and correlations.
- Export & Share: After completing the chart, choose to export the chart in JPEG, PNG, or PDF format, or share the chart link with others for easy team collaboration and presentation.
Core Advantages of Love Chart
- intellectualize: Based on AI technology, it automatically analyzes data features to recommend chart types and provide data analysis reports to help users understand the data in depth.
- usabilityThe interface is simple and intuitive, drag-and-drop operation can generate charts, support for a variety of data sources to import, reduce the threshold of use.
- feature-richIt provides a variety of chart types, AI text and image generation functions to meet the needs of diversified data presentation and content creation.
- customization: Rich templates and style options, support for personalized customization of charts, a variety of formats to meet the export of different use scenarios.
- efficiency: AI quickly generates high-quality charts and supports real-time data updating, saving time and improving work efficiency.
People for Love Chart
- business user: Used to produce business reports, market analysis, sales data display, etc., to enhance the professionalism and readability of the report, to help business managers make quick decisions.
- content creator: Ideal for creating charts and graphic content suitable for social media sharing, enhancing the appeal and distribution of the content.
- Researchers and students: Helps transform complex data into intuitive charts and graphs for academic research and paper writing, presenting research results more clearly.
- Data Analyst: Quickly generate charts and graphs, analyze data, increase productivity, and better understand the meaning behind the data.
- educator: Used in the production of teaching courseware, the boring data will be presented to students in the form of intuitive charts and graphs to improve the teaching effect.
© Copyright notes
Article copyright AI Sharing Circle All, please do not reproduce without permission.
Related posts

No comments...

