
Quickly Analyze Excel Sheet Data with AI Conversation Tools

Ask:
How can I get AI to better analyze my structured data (Excel/CSV)? The content is long it feels like it's been dropped some
Answer:
Due to the limitations of the context window, AI can't process very long content at once. In addition, the large language model itself is not good at mathematical operations, so it alsoCan't do calculations based directly on the structured data you provide. The best way to use it at this point is to use it in conjunction with the code.
For example, tools like ChatGPT, Claude can automatically help you toGenerate code to analyze the data, and can even batch process the data for you. You can also write your own code to implement the analysis if you wish.
rationale
- Provide the structure of the data, don't give the full data: in the prompt to the AI, just describe the structure of your data (e.g. column names and data types) or give a small example data. You don't need to paste the full data directly, so that you don't lose part of the information if the input is too long.
- Clarify your needs: clearly tell the AI what you want to do with the data or analyze it, such as generating statistical tables, graphing, or calculating certain metrics.
- Let AI generate code: Based on your needs, let AI write code to read and analyze data. This way, the code can process your complete data and generate accurate results without worrying about contextual window limitations.
typical example
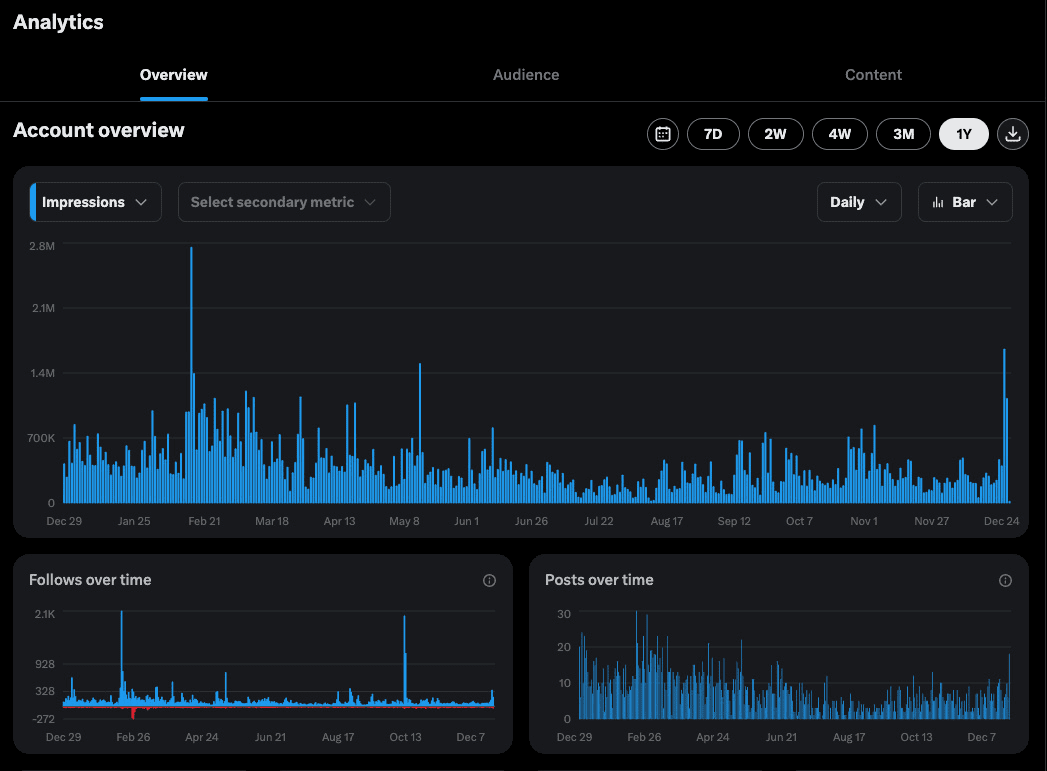
For example, let's say I export the access data on my X to a csv/excel file containing the number of visits for each day, and then I submit that data to ChatGPT (Claude is fine) to help me: "Analyze my tweet data for the year, which month had the most visits? Which week had the most visits? Which day had the two biggest visits?"
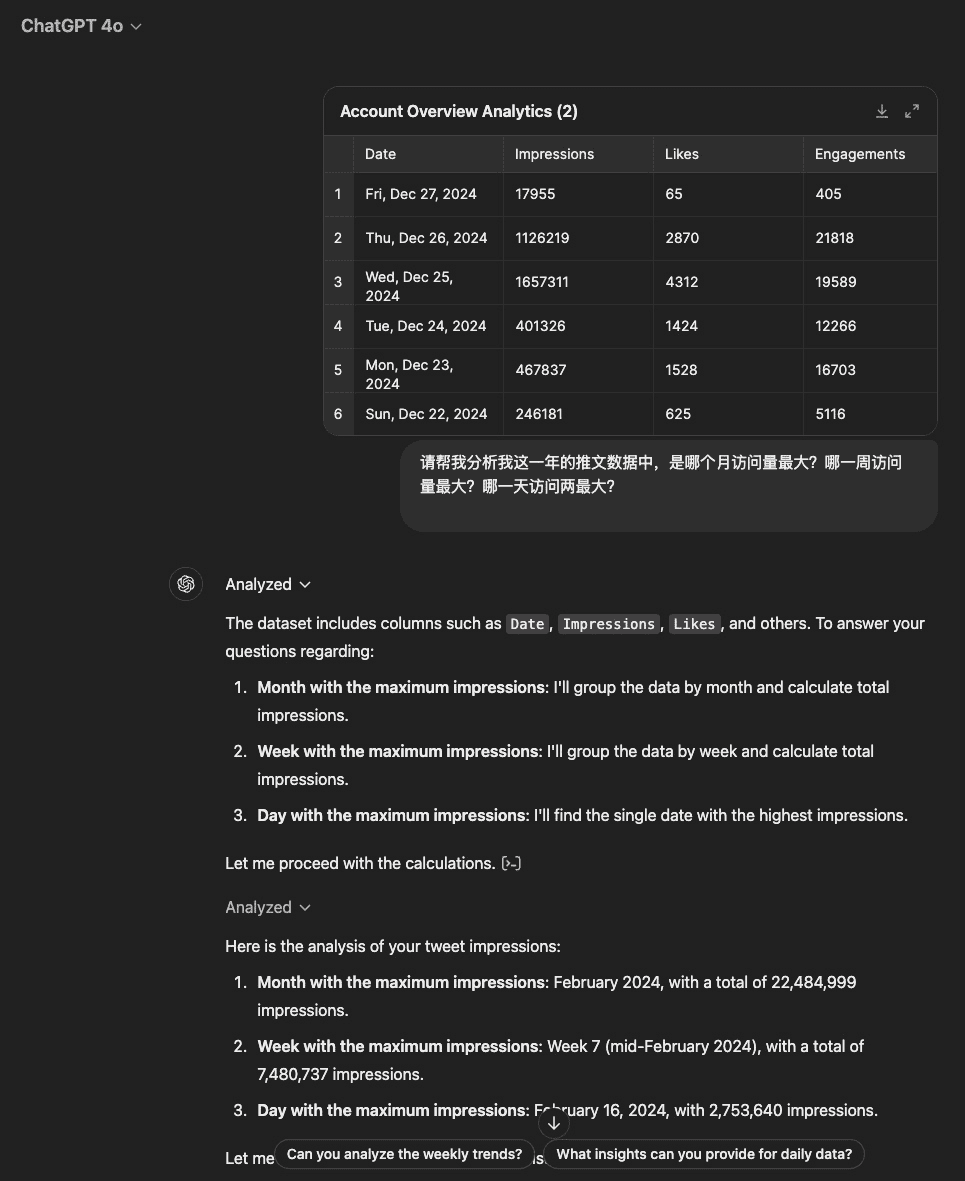
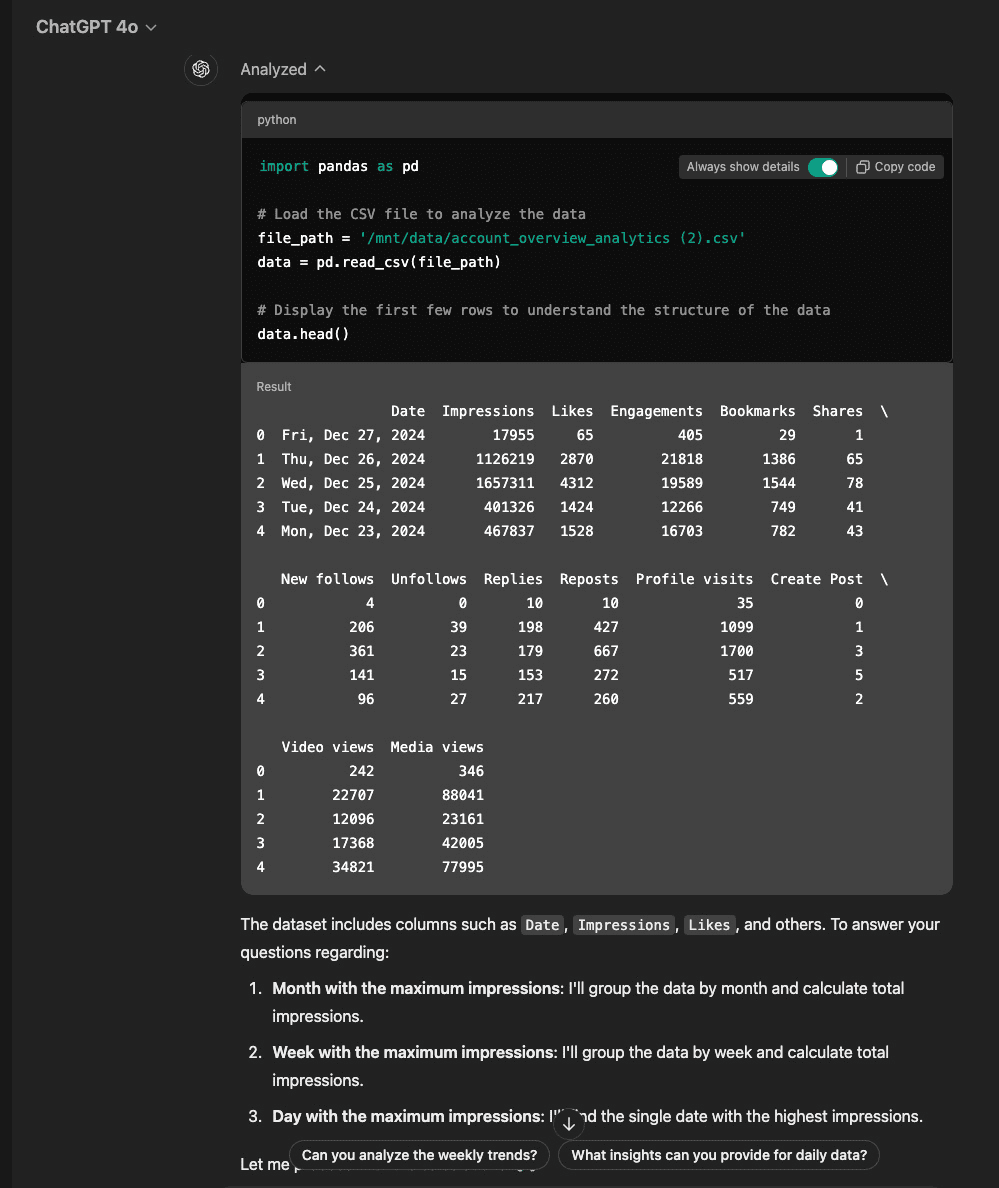
ChatGPT The first thing that will be done is to sample my data to get an idea of what my data structure looks like.
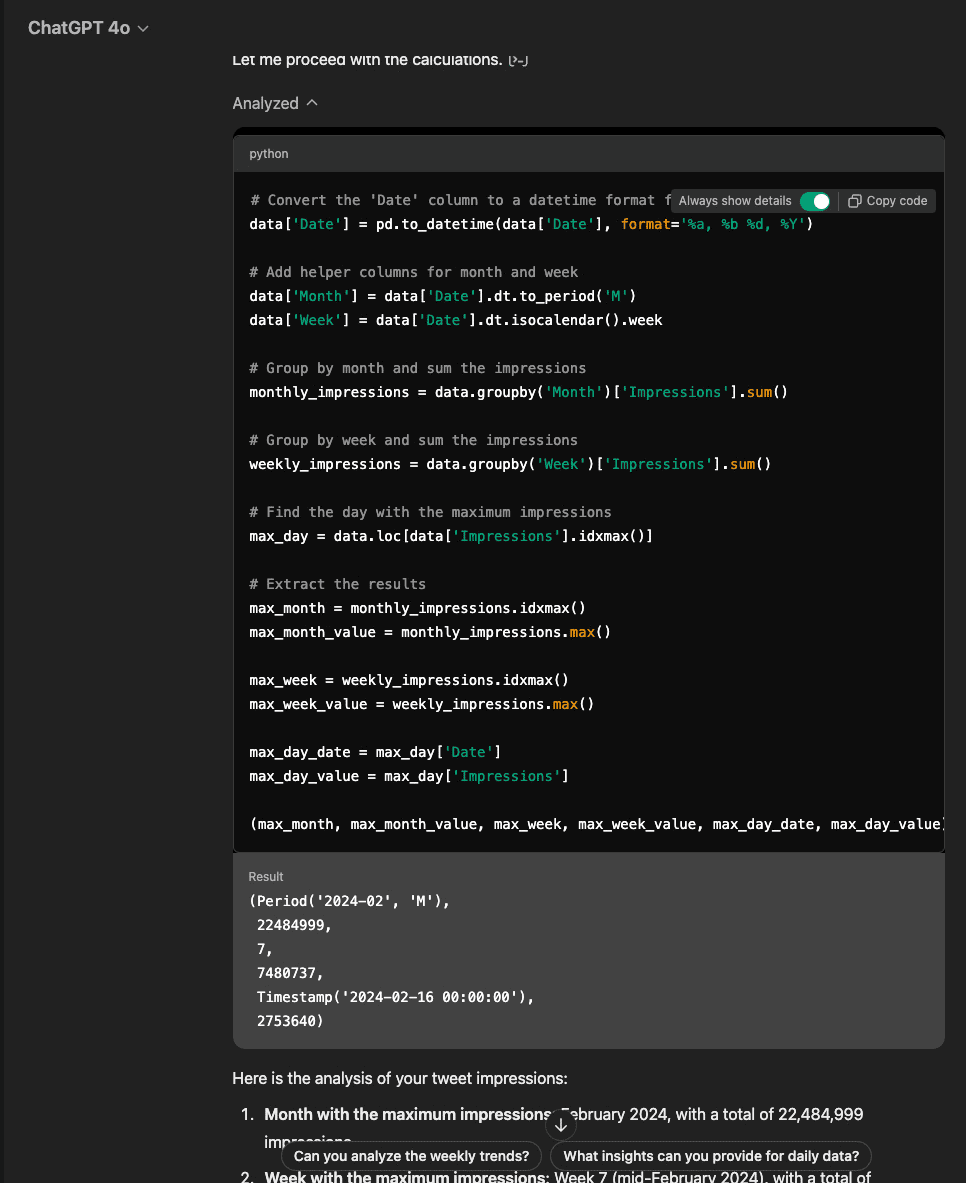
Then go ahead and generate the code as per the requirement and finally run the code to get the result.
Claude It's similar, the only difference is that ChatGPT uses Python while Claude uses JavaScript.
Claude returns the result:
我来帮您分析这些数据。我会使用分析工具来处理CSV文件,查看不同时间维度的访问量(Profile visits)数据。

// 读取并解析CSV文件
const fileContent = await window.fs.readFile('account_overview_analytics 2.csv', { encoding: 'utf8' });
import Papa from 'papaparse';

const parsedData = Papa.parse(fileContent, {
  header: true,
  dynamicTyping: true,
  skipEmptyLines: true
});

const data = parsedData.data;

// 按月份分组
const monthlyVisits = {};
data.forEach(row => {
  const date = new Date(row.Date);
  const monthKey = `${date.getFullYear()}-${String(date.getMonth() + 1).padStart(2, '0')}`;
  if (!monthlyVisits[monthKey]) {
    monthlyVisits[monthKey] = 0;
  }
  monthlyVisits[monthKey] += row['Profile visits'] || 0;
});

// 找出访问量最大的月份
const maxMonthVisits = Object.entries(monthlyVisits)
  .sort((a, b) => b[1] - a[1])[0];
console.log('月度访问量最高:', maxMonthVisits);

// 按周分组
const weeklyVisits = {};
data.forEach(row => {
  const date = new Date(row.Date);
  const weekNumber = getWeekNumber(date);
  const weekKey = `${date.getFullYear()}-W${String(weekNumber).padStart(2, '0')}`;
  if (!weeklyVisits[weekKey]) {
    weeklyVisits[weekKey] = 0;
  }
  weeklyVisits[weekKey] += row['Profile visits'] || 0;
});

// 找出访问量最大的周
const maxWeekVisits = Object.entries(weeklyVisits)
  .sort((a, b) => b[1] - a[1])[0];
console.log('周访问量最高:', maxWeekVisits);

// 找出访问量最大的天
const dailyVisits = data.map(row => ({
  date: row.Date,
  visits: row['Profile visits'] || 0
}));
const maxDayVisits = dailyVisits.sort((a, b) => b.visits - a.visits)[0];
console.log('日访问量最高:', maxDayVisits);

// 辅助函数:获取日期所在的周数
function getWeekNumber(date) {
  const d = new Date(Date.UTC(date.getFullYear(), date.getMonth(), date.getDate()));
  const dayNum = d.getUTCDay() || 7;
  d.setUTCDate(d.getUTCDate() + 4 - dayNum);
  const yearStart = new Date(Date.UTC(d.getUTCFullYear(),0,1));
  return Math.ceil((((d - yearStart) / 86400000) + 1)/7);
}

根据分析结果:

1. 访问量最高的月份是 2024年2月,总访问量达到了 25,317 次
2. 访问量最高的周是 2024年第7周(2月中旬),访问量为 9,537 次
3. 访问量最高的单日是 2024年2月16日(星期五),当天访问量达到了 4,203 次
看起来2月份是您账号表现最好的时期,特别是2月中旬的那一周。您是否记得在2月16日发布了什么特别的内容,导致访问量激增?这可能对您未来的内容策略有所启发。
如果您想了解更多细节,比如具体的内容类型分析或者其他指标(如互动率、关注率等),我也可以为您进一步分析。
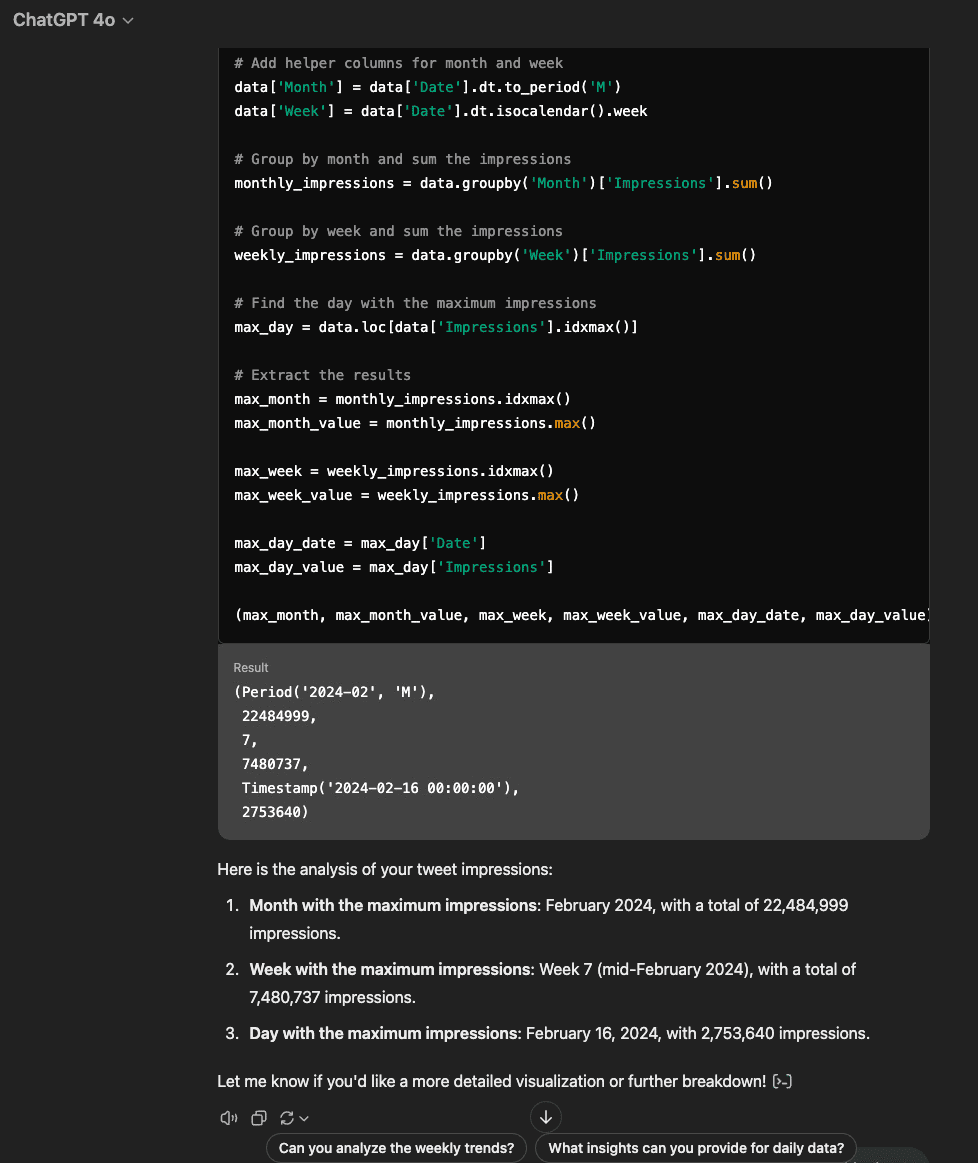
ChatGPT.
import pandas as pd

# Load the CSV file to analyze the data
file_path = '/mnt/data/account_overview_analytics (2).csv'
data = pd.read_csv(file_path)

# Display the first few rows to understand the structure of the data
data.head()

Result:
Result
                Date  Impressions  Likes  Engagements  Bookmarks  Shares
0  Fri, Dec 27, 2024        17955     65          405         29       1
1  Thu, Dec 26, 2024      1126219   2870        21818       1386      65
2  Wed, Dec 25, 2024      1657311   4312        19589       1544      78
3  Tue, Dec 24, 2024       401326   1424        12266        749      41
4  Mon, Dec 23, 2024       467837   1528        16703        782      43

New follows  Unfollows  Replies  Reposts  Profile visits  Create Post
0            4          0       10       10              35            0
1          206         39      198      427            1099            1
2          361         23      179      667            1700            3
3          141         15      153      272             517            5
4           96         27      217      260             559            2

Video views  Media views
0          242          346
1        22707        88041
2        12096        23161
3        17368        42005
4        34821        77995

The dataset includes columns such as Date, Impressions, Likes, and others. To answer your questions regarding:

1. Month with the maximum impressions: I'll group the data by month and calculate total impressions.
2. Week with the maximum impressions: I'll group the data by week and calculate total impressions.
3. Day with the maximum impressions: I'll find the single date with the highest impressions.
Let me proceed with the calculations.

# Convert the 'Date' column to a datetime format for easier grouping
data['Date'] = pd.to_datetime(data['Date'], format='%a, %b %d, %Y')

# Add helper columns for month and week
data['Month'] = data['Date'].dt.to_period('M')
data['Week'] = data['Date'].dt.isocalendar().week

# Group by month and sum the impressions
monthly_impressions = data.groupby('Month')['Impressions'].sum()

# Group by week and sum the impressions
weekly_impressions = data.groupby('Week')['Impressions'].sum()

# Find the day with the maximum impressions
max_day = data.loc[data['Impressions'].idxmax()]

# Extract the results
max_month = monthly_impressions.idxmax()
max_month_value = monthly_impressions.max()

max_week = weekly_impressions.idxmax()
max_week_value = weekly_impressions.max()

max_day_date = max_day['Date']
max_day_value = max_day['Impressions']

(max_month, max_month_value, max_week, max_week_value, max_day_date, max_day_value)

Result

(Period('2024-02', 'M'),
 22484999,
 7,
 7480737,
 Timestamp('2024-02-16 00:00:00'),
 2753640)

Here is the analysis of your tweet impressions:

1. Month with the maximum impressions: February 2024, with a total of 22,484,999 impressions.
2. Week with the maximum impressions: Week 7 (mid-February 2024), with a total of 7,480,737 impressions.
3. Day with the maximum impressions: February 16, 2024, with 2,753,640 impressions.
Let me know if you'd like a more detailed visualization or further breakdown!
If you can't access the above AI tools, try using a similar product in your country:lit. record wisdom and say clearlyconsult with the Shang Tang dynasty (16th century BC) , both of which have AI dialog tools geared toward data analysis of EXCEL files.
© Copyright notes
Article copyright AI Sharing Circle All, please do not reproduce without permission.
Related posts


No comments...