Rows: a data-driven spreadsheet tool
General Introduction
Rows is an innovative spreadsheet tool designed to simplify importing, converting and sharing data. It not only provides the functionality of a traditional spreadsheet, but also integrates real-time data reporting and automated data analysis. Users can create powerful data tools with a simple interface and without writing code.Rows' goal is to enable the world's one billion spreadsheet users to work more efficiently.
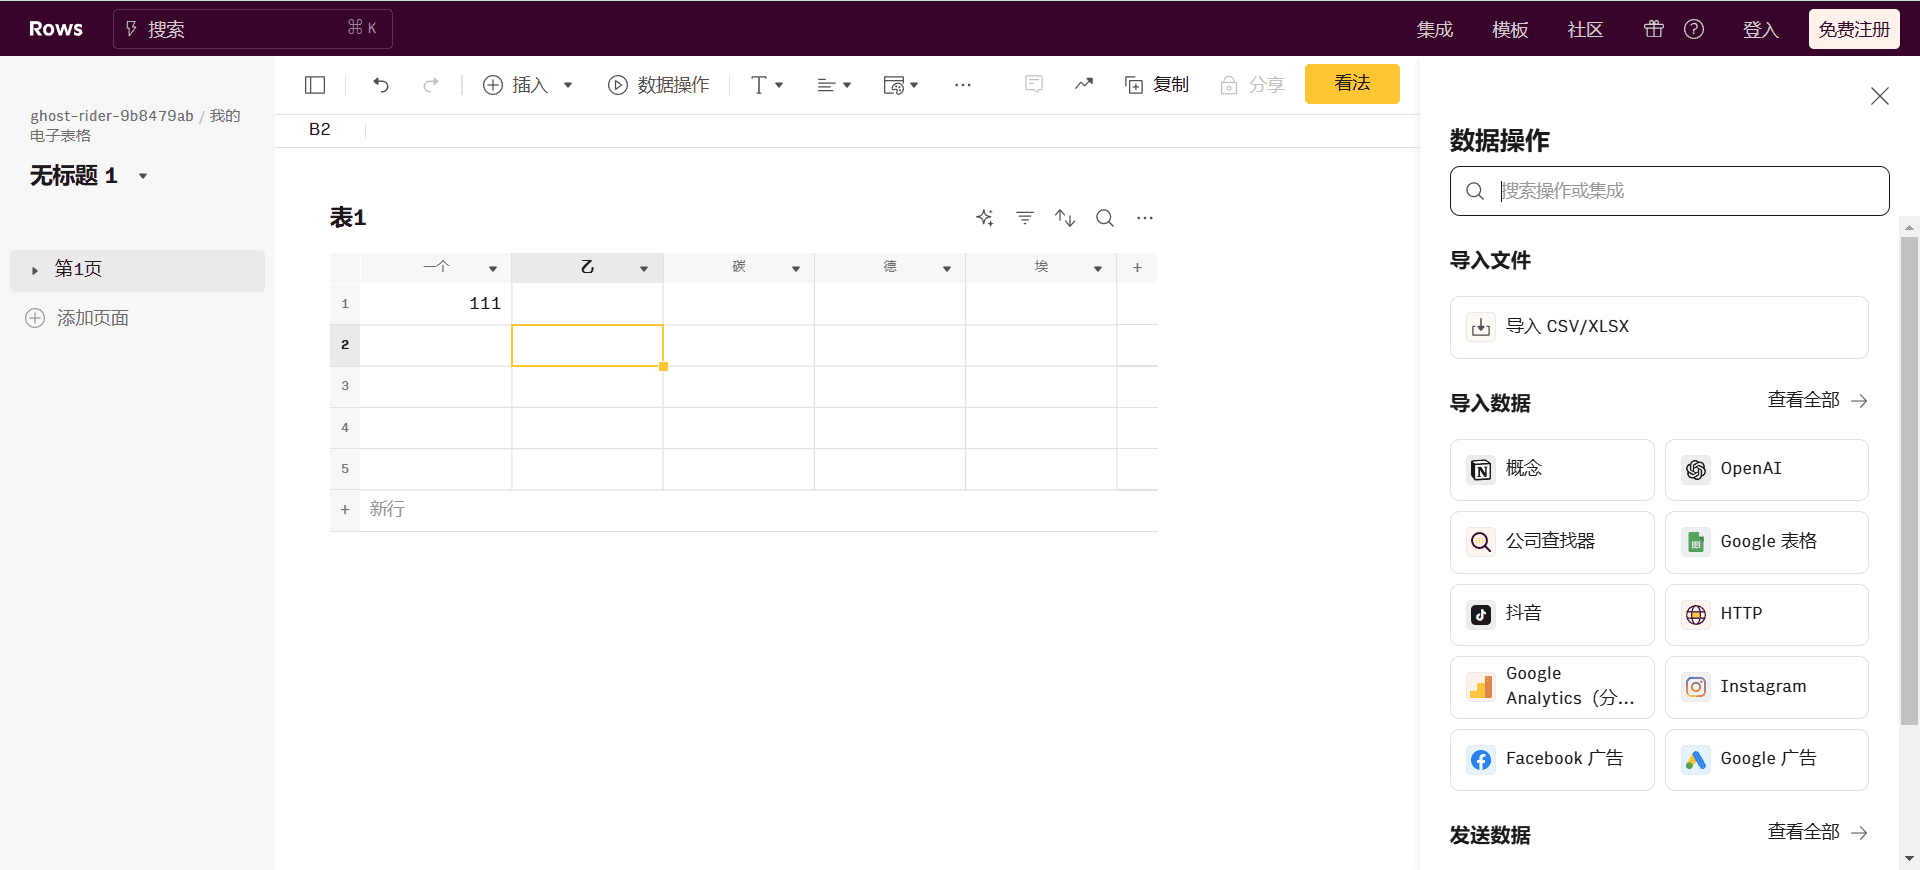
Function List
- Data Import: Supports importing data from multiple data sources, including APIs, databases, and files.
- Data Conversion: Provides a variety of data conversion tools to help users clean and organize data.
- Real-time data reports: Users can create real-time updated data reports for easy data monitoring and analysis.
- Automation: With built-in automation tools, users can set up automated tasks to reduce manual operations.
- Data Sharing: Supports sharing of data and reports with team members to improve collaboration efficiency.
Using Help
Installation and Registration
- Visit the official Rows website.
- : Click the "Register" button in the upper right corner and fill in the necessary information to complete the registration.
- Once registration is complete, log in to your account to get started.
Data import
- Click the "Import Data" button on the main screen.
- Select the type of data source (e.g., API, database, or file).
- Follow the prompts to enter the necessary connection information or upload a file.
- Click the "Import" button and the data will be automatically imported into the spreadsheet.
data conversion
- Select the data columns or cells that need to be converted.
- Click on the "Data Conversion" toolbar and select the desired conversion tool (e.g. cleaning, formatting, etc.).
- Follow the prompts to complete the conversion settings and click the "Apply" button.
Create real-time data reports
- Click the "Create Report" button on the main screen.
- Select the data source and set the report parameters.
- Configure how the report is displayed (e.g., charts, tables, etc.).
- Click the "Save" button and the report will be updated in real time and displayed on the interface.
Setting up automated tasks
- Click the "Automation" button on the main screen.
- Select the type of task to be automated (e.g., data import, report generation, etc.).
- Follow the prompts to set up automation rules and trigger conditions.
- Click the "Save" button and the automation task will be executed according to the set rules.
data sharing
- Select the data or reports to be shared from the main screen.
- Click on the "Share" button and enter the e-mail addresses of your team members.
- Set sharing permissions (e.g., read-only, edit, etc.).
- Click on the "Send Invitation" button and team members will receive the sharing invitation.
© Copyright notes
Article copyright AI Sharing Circle All, please do not reproduce without permission.
Related posts

No comments...

