Narrative BI: Connect multiple spreadsheet data for dialogic queries and generate business insights (paid)
General Introduction
Narrative BI is a platform focused on automated data analytics that utilizes artificial intelligence technology to provide users with natural language-generated business insights. Its core product, AI Data Analyzer, automatically extracts meaningful conclusions from data without requiring users to have a complex technical background. The platform is particularly well suited for marketers, growth teams, and business executives to help them accelerate decision making through a streamlined data analysis process.Narrative BI supports connectivity to a wide range of data sources, including Google Analytics 4, Google Ads, and more, and is designed to make data easier to understand and utilize.

Function List
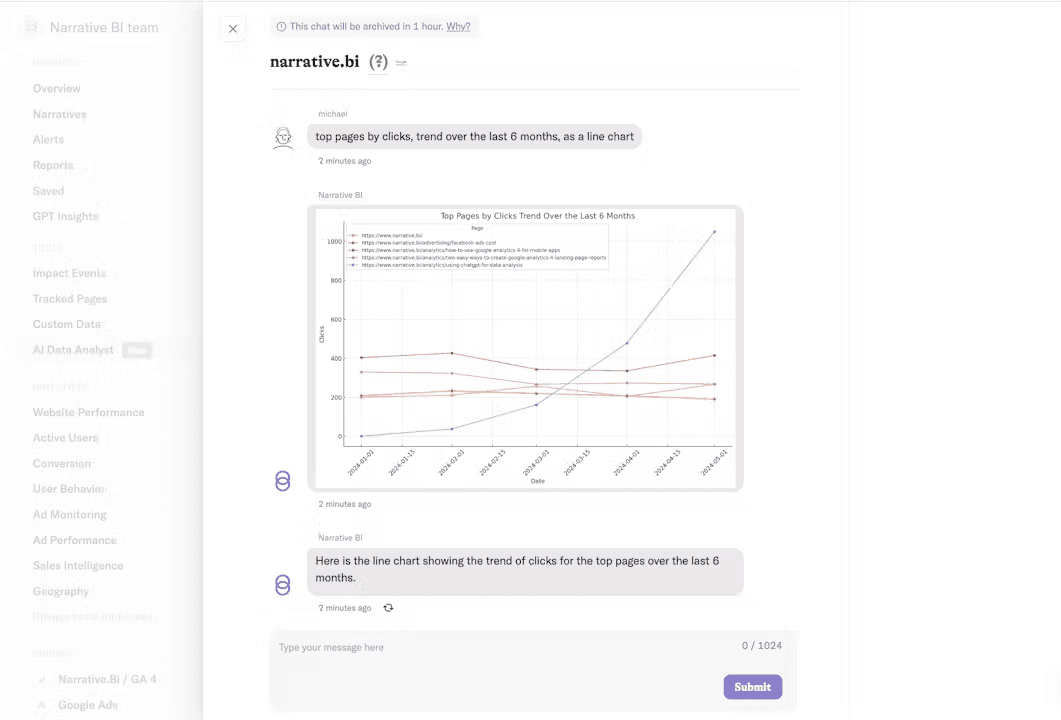
- natural language query: Users can ask data questions and get answers through a dialog-based interface.
- Automatic Insight Generation: The platform automatically analyzes data and provides real-time insights, reducing manual analysis time.
- Multi-data source integration: Supports connection to major data sources such as GA4, Google Ads, HubSpot, etc.
- data visualization: Generate charts and reports through AI to aid decision making.
- Instant Reports: Provides instantly generated reports to help users quickly capture key data points.
Using Help
Connecting to a data source
First, visit the Narrative BI homepage and click on "Connect to Data Sources". Here, you can choose from dozens of data sources that are already supported, such as Google Analytics 4, Google Ads, HubSpot, Salesforce, and more. Click on the appropriate data source icon and you will be guided through the authorization process, which usually involves logging into the data source's account and granting Narrative BI access. Once authorization is complete, the data source will be connected to Narrative BI and the data will begin to sync.
Using AI Data Analysts
Once the data source is successfully connected, you can use AI Data Analyzer immediately. The first time you access it, the system will automatically generate a series of basic insight reports. You can use it further by following the steps below:
- Asking questions about data::
- In the Q&A module, you can ask questions in natural language. For example, "How did sales perform this week?" Or "Which ad channel is working best?" AI analysts will provide detailed answers based on your data.
- in-depth analysis::
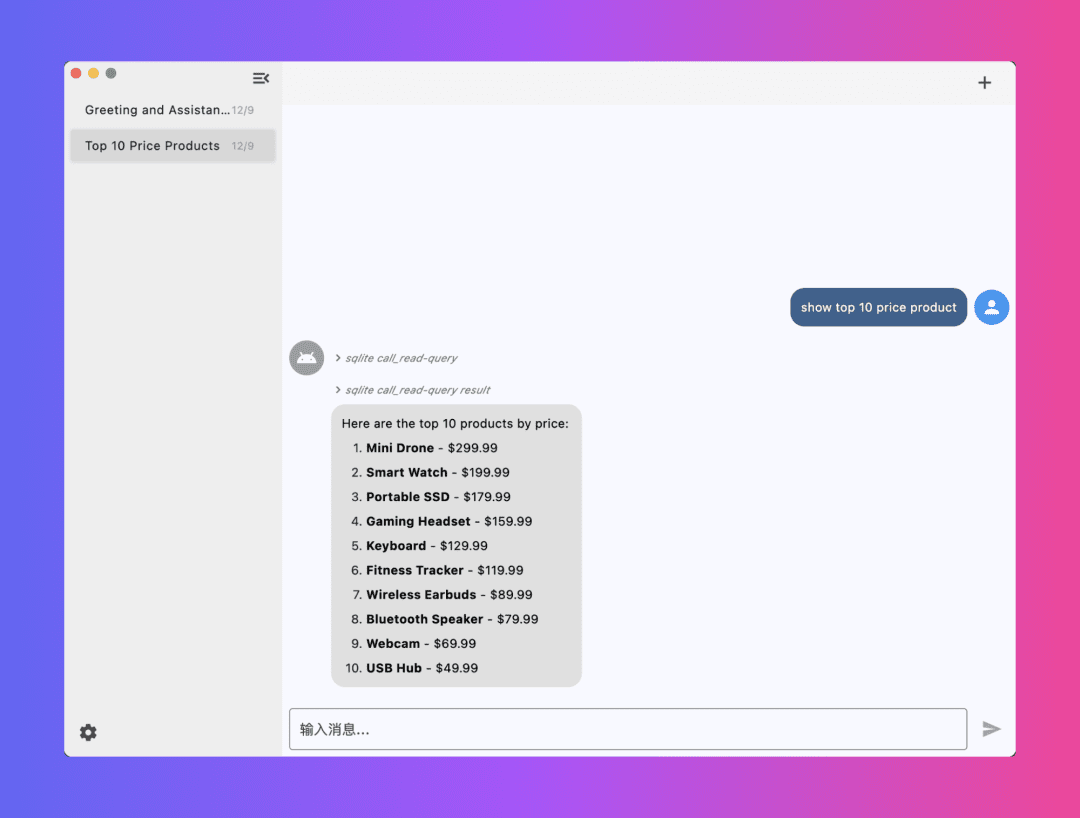
- For questions that require more in-depth analysis, you can upload CSV or XLSX files, which AI Data Analyst supports for instant analysis. Simply click "Upload Files", select your file, and ask the question in the dialog box. For example, "Which products sold the most in the past month?" .
- Automated Insight::
- Narrative BI automatically identifies anomalies and trends in the data and provides natural language descriptions. These insights are presented in a "narrative" format, such as "We noticed a 15% increase in website traffic this weekend, primarily from social media ads".
- Customized reports::
- You can create customized reports. Click "New Report", select the data you want to analyze, and then select the metrics and dimensions you want to display through the drag-and-drop interface. When you are done, AI will automatically generate the appropriate charts and analysis results.
Reports and Alerts
- Periodic reports: Set up a schedule for automatically sending reports, either daily, weekly or monthly. Reports can be sent to your email or Slack channel.
- Abnormal AlarmsIf you want to be notified when the data is abnormal, you can set a specific condition, such as "If the conversion rate is lower than X%", the system will notify you via email or Slack.
Tips and Best Practices
- Regularly update data sources: Ensure that your data sources are synchronized to prevent stale data during analysis.
- Optimize queries: Try to ask specific questions, such as "Which product line had the highest profitability in the last 30 days?" Rather than generalized inquiries.
- Combined use of manual and automated analysis: While AI provides a lot of automated insights, combining it with manual analysis can uncover subtle points that AI may have overlooked.
Using Narrative BI not only dramatically reduces the amount of work required to analyze your data, but also gives it more value in the decision-making process. Through constant use and adaptation, you can better master the art of data-driven decision making.
© Copyright notes
Article copyright AI Sharing Circle All, please do not reproduce without permission.
Related posts

No comments...


