Convert text descriptions or documents into beautiful conceptual diagrams and quickly illustrate PPTs or articles.
I think the odds are that it will be pictures, tables, flowcharts.
Today we recommend you a free AI text to visual tool.The texture is a bit of an oxymoron, it feels like a big factory texture like Figma, simple yet powerful.

Of course, it can also be a beautiful and practical tool for notes and documents.
Introduction to Tools
Napkin AI is a free text-to-visual content conversion tool that automatically transforms text information into visual materials such as charts, flowcharts and infographics through AI technology. Users just need to paste the text into the platform and click the Generate button to get the relevant visual content quickly. The tool is easy to use, requires no specialized design skills, and is suitable for a wide range of scenarios such as business PPT, social media publishing, and education.Napkin AI provides rich custom editing features and supports exporting to multiple formats, such as PNG, SVG, and PDF, making it easy to use on different platforms.
Schematic Demonstration
Check out the demo first and scroll down for usage.
1. PPT

2. Blogs

3、Social Media Matching
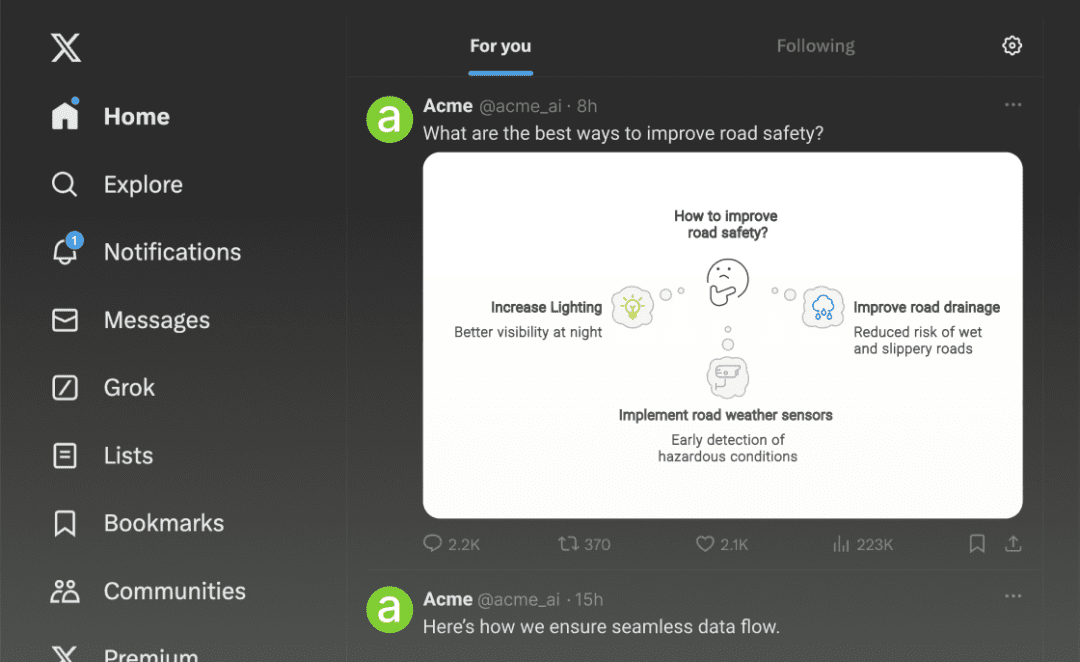
4. Documentation

Usage
1. Content sources
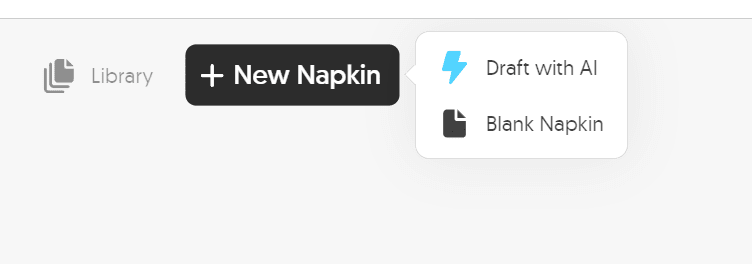
There are two ways thatone type ofCopy what's already written right in.

another.Generated directly in AI inside this tool.
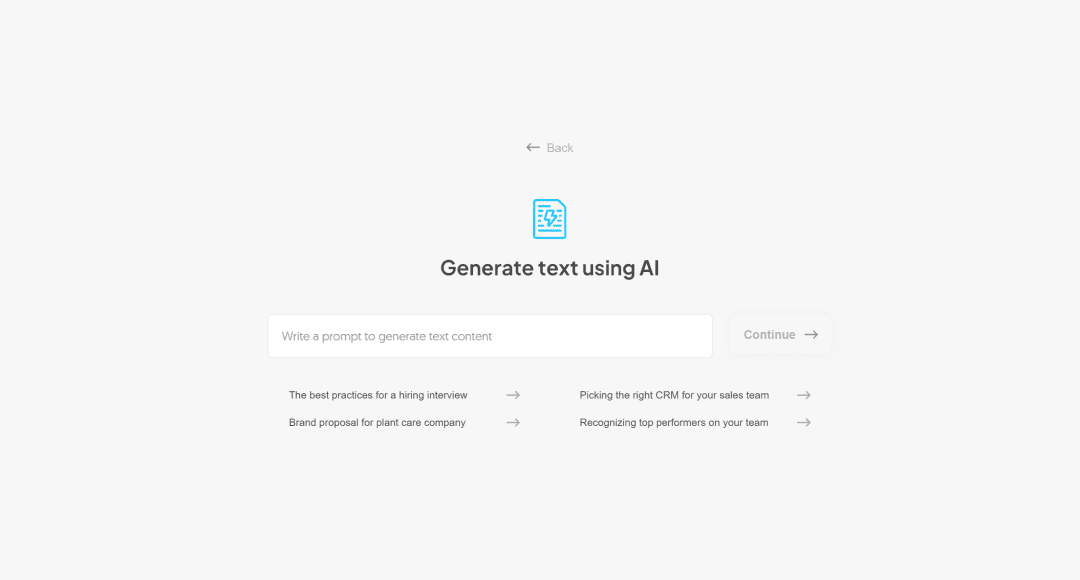
I've gone straight to the demo with AI generated content.
2、Generate visual effects
Arrow to a paragraph of text and this little lightning bolt symbol will appear, click on this button.

Choose the approximate style first.
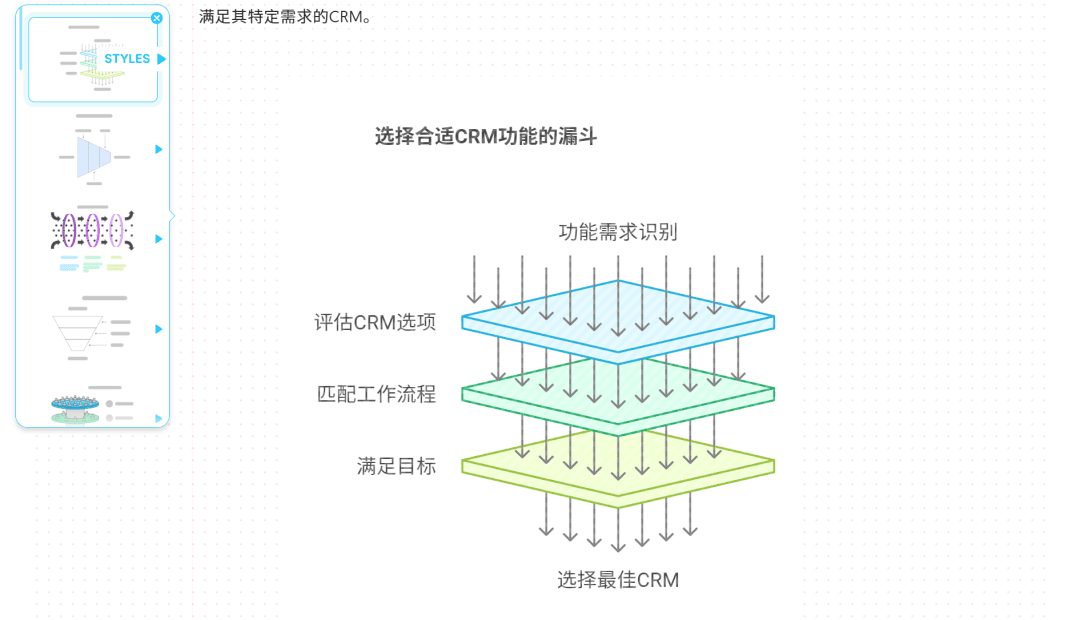
There will be a second step of refinement after the selection, which will require another selection.

If you feel up to this point you are ready, then you can just save this image. Of course, there's more than that. It can also be optimized more deeply.
3、Optimization
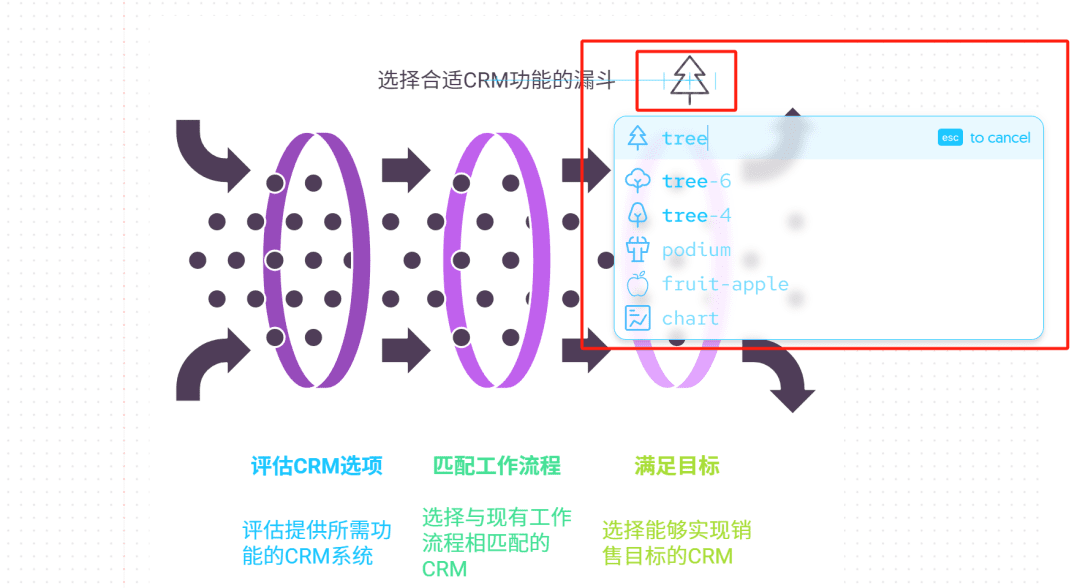
If you want to add or replace some icons, you can click on the little lightning bolt.

Type in what kind of icon you want, and you can find it from the massive icon library.
I tried some and the texture is bullish.
Of course, the various texts in the chart are adjustable.

The various branching structures of the chart are also adjustable.

The features are all very simple to use, or at least much simpler than Figma.
© Copyright notes
Article copyright AI Sharing Circle All, please do not reproduce without permission.
Related posts

No comments...


