GraphMaker: AI Intelligent Chart Generation and Data Visualization (paid)
General Introduction
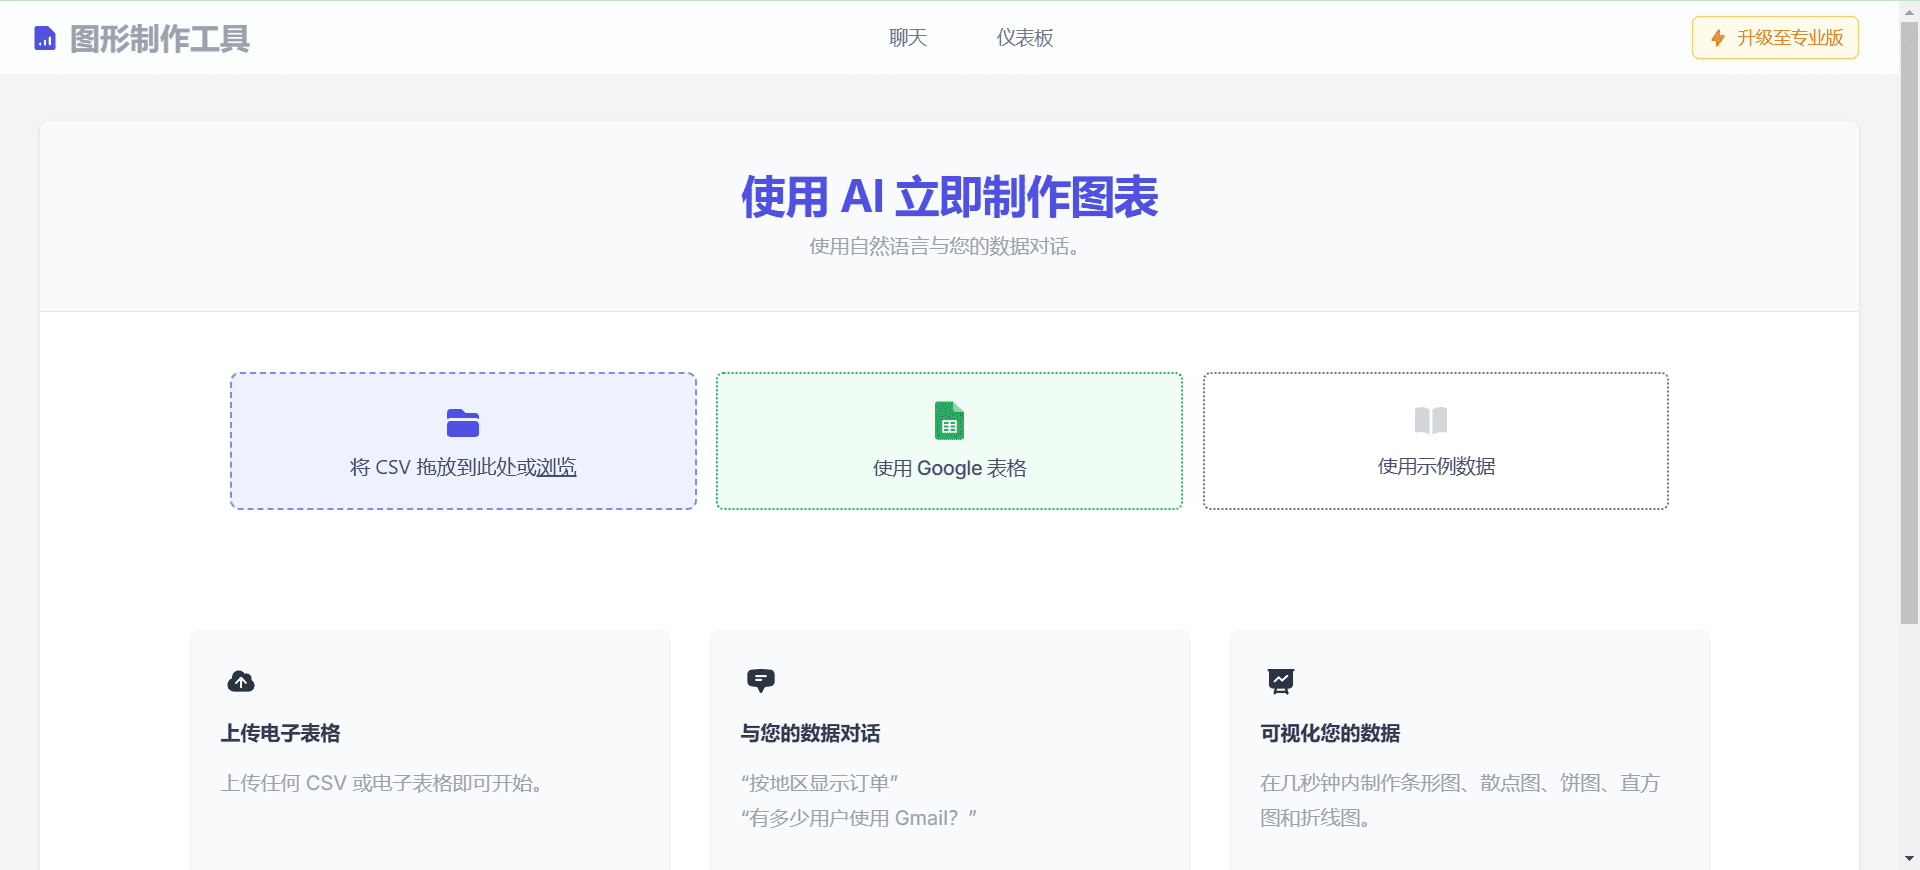
GraphMaker is a chart generation and data visualization tool based on artificial intelligence technology. Users can talk to GraphMaker through natural language to quickly generate various types of charts, such as bar charts, scatter charts, pie charts, histograms and line charts. The tool supports multiple data formats, including CSV and Excel files, and is designed to help users quickly and easily analyze and visualize data.


Function List
- Natural Language Generation: Generate charts from natural language inputs
- Multiple Chart Types: Bar, Scatter, Pie, Histogram, and Line Chart support
- Data format compatibility: CSV and Excel file support
- Data security: commitment not to store user data
- Project Management: Support for organizing chats into projects, uploading data sources and adding custom commands
- Code Execution: Supports generation and execution of simple JavaScript code.
Using Help
Usage Process
- Open the GraphMaker client and log in to your account
- Importing CSV or Excel files to be processed
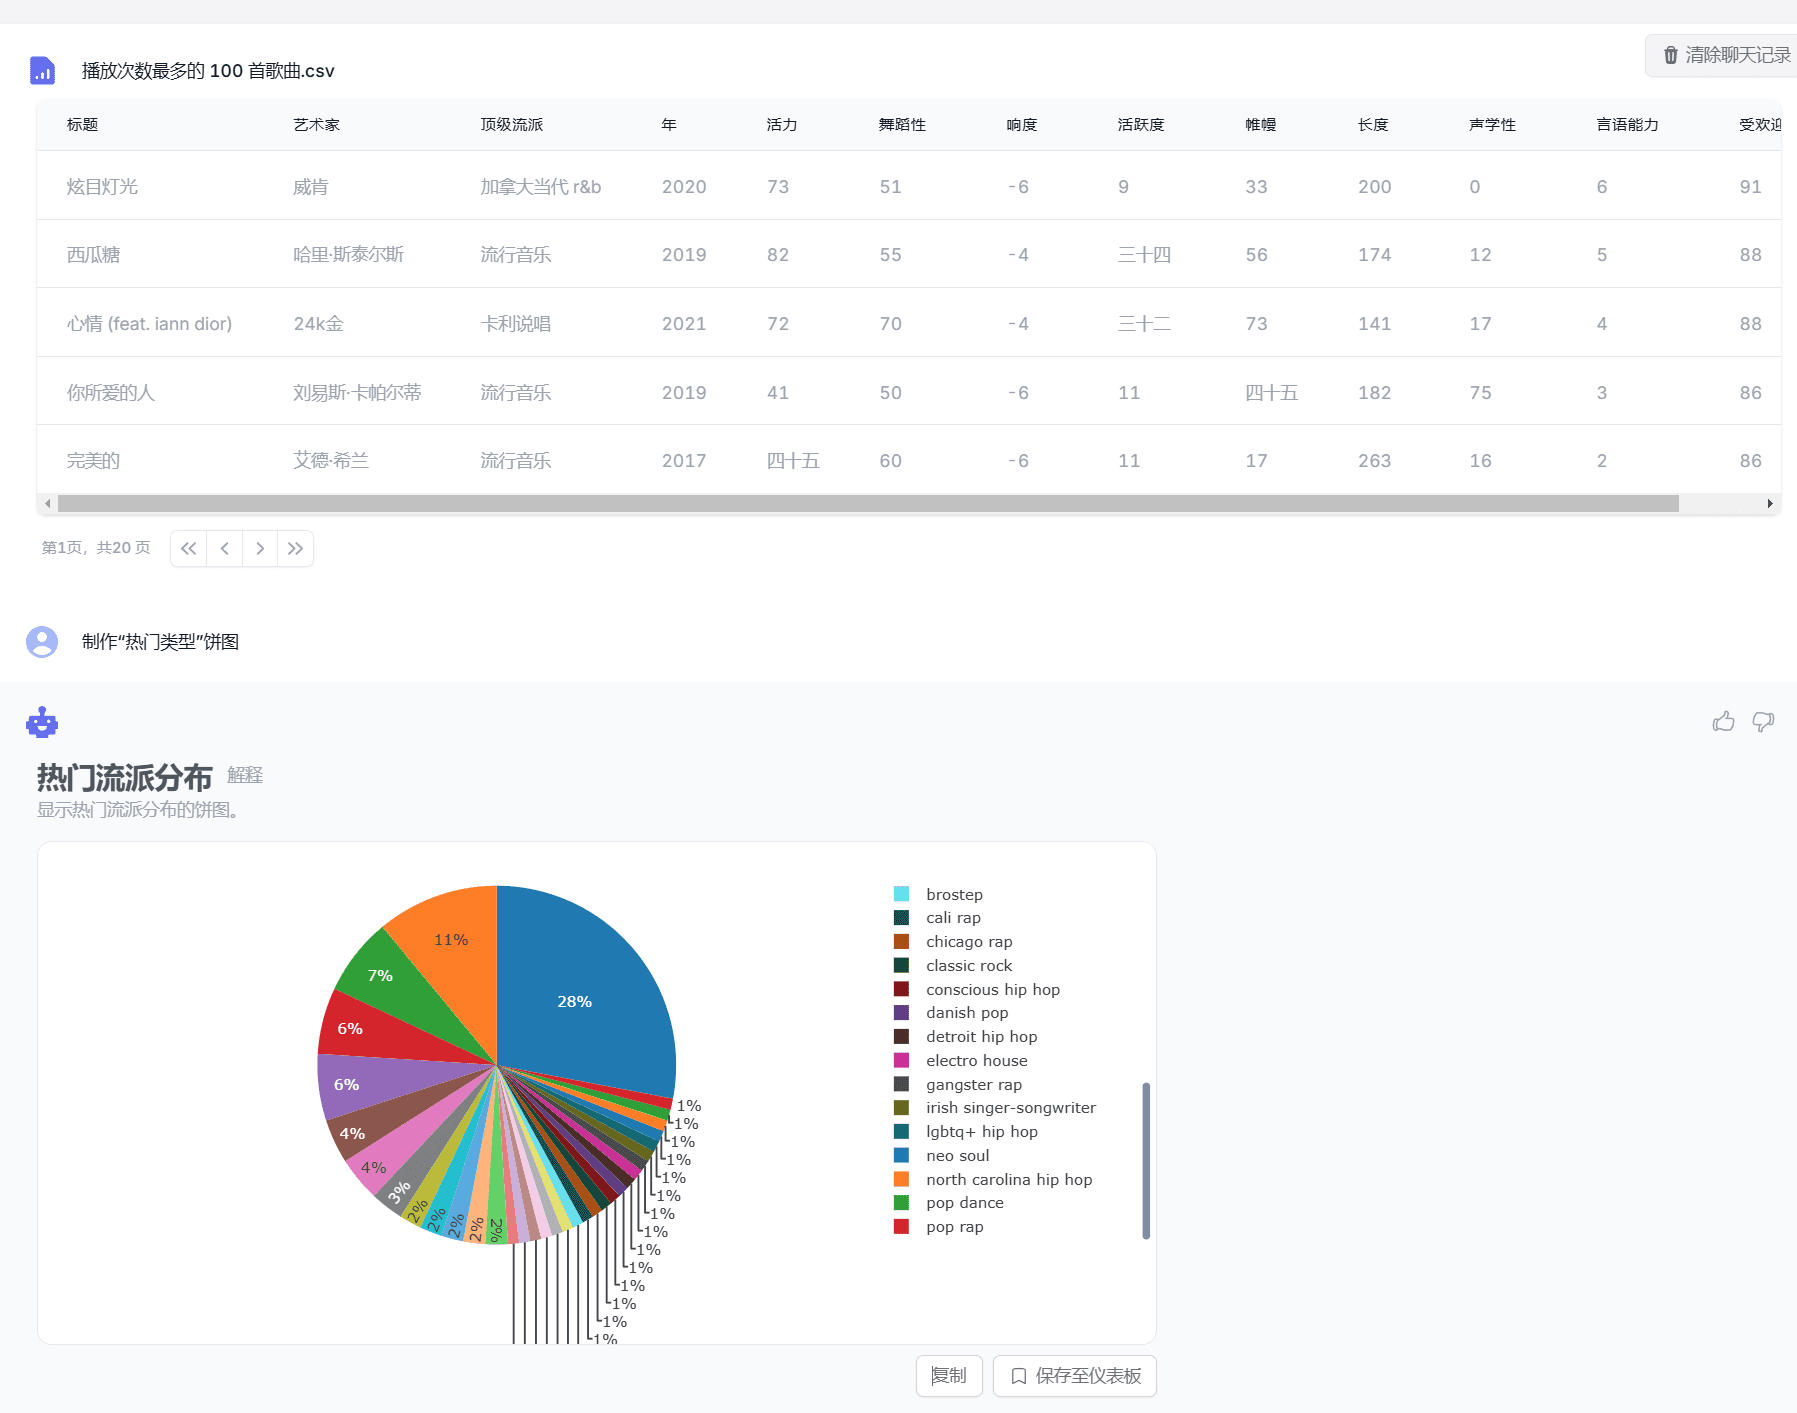
- In the dialog box, enter the type of chart you want to generate and the instructions for analyzing the data, e.g., "Generate Bar Chart" or "Show Order Distribution by Region".
- GraphMaker automatically generates the corresponding chart and displays the generated content in the right-hand window
- Users can customize the generated charts as needed and export the charts for reports or presentations
Functional operation details
natural language generation
GraphMaker uses natural language processing technology to understand the commands entered by the user and automatically generates the corresponding charts. For example, if you type "Generate Bar Chart", GraphMaker will automatically generate the corresponding chart and display the generated content in the right window.
Multiple chart types
GraphMaker supports generating many types of charts, including bar charts, scatter charts, pie charts, histograms and line charts. Users can choose the appropriate chart type as needed to better present the data.
Data format compatibility
GraphMaker supports a variety of data formats, including CSV and Excel files. Users can upload data files to GraphMaker for data analysis and chart generation.
data security
GraphMaker is committed to ensuring the security of user data by not storing it. You can use GraphMaker for data analysis and chart generation with confidence.
project management
GraphMaker supports organizing chats into projects, and users can upload data sources and add custom commands to ensure that GraphMaker has better contextual understanding when responding.
code execution
GraphMaker supports generation and execution of simple JavaScript code. Users can enter commands in a dialog box and GraphMaker will automatically generate and execute the code and return the results.
Frequently Asked Questions
- How do I sign up for an account?
- Visit the GraphMaker website, click the "Sign Up" button, fill out the registration information and submit.
- How do I generate a chart?
- Enter the type of chart you want to generate and the data analysis instructions in the dialog box, and GraphMaker will automatically generate the appropriate chart and display the generated content in the right window.
- How to customize the generated charts?
- GraphMaker supports a wide range of customization options that allow you to tailor the generated charts to meet your project requirements.
- How do I export a chart?
- In the generated chart window, click the "Export" button and select the export format to export the chart for reporting or presentation.
© Copyright notes
Article copyright AI Sharing Circle All, please do not reproduce without permission.
Related posts

No comments...


