Python in Excel is now available for Microsoft 365 Business and Enterprise Windows users!
Python in Excel is now officially available for Windows users of Microsoft 365 Business and Enterprise. Last August, Microsoft partnered with Anaconda to introduce an exciting addition to Excel by integrating Python, making it possible to seamlessly combine Python and Excel analysis into the same workbook, with no setup required. Since then, we've brought the power of popular Python analysis libraries like pandas, Matplotlib, and NLTK to countless Excel users.
Of course, a subscription to Microsoft 365 Business or Enterprise is required to use Python in Excel.
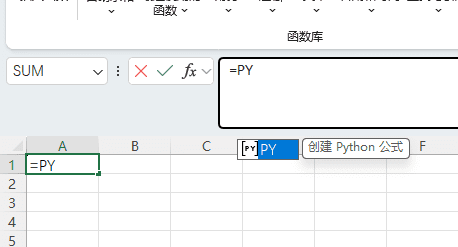
Open Excel, click "Formula" - "Insert Python":
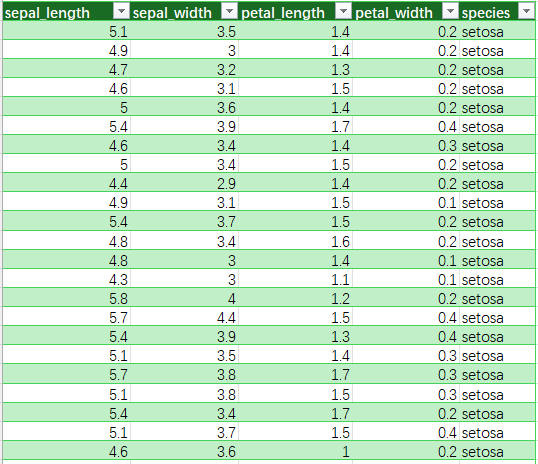
We have the following data:
If you know how to use the Python language
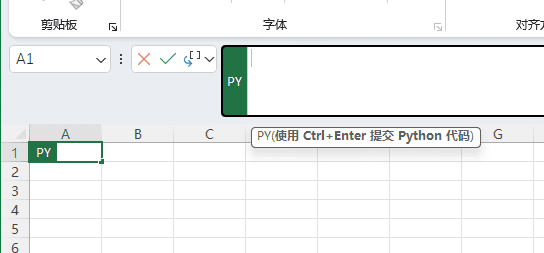
Enter it in the PY input box:
sample_df = xl("IrisDataSet8[#全部]", headers=True)
sample_df.describe()
Generate a dataframe to expand the description information:
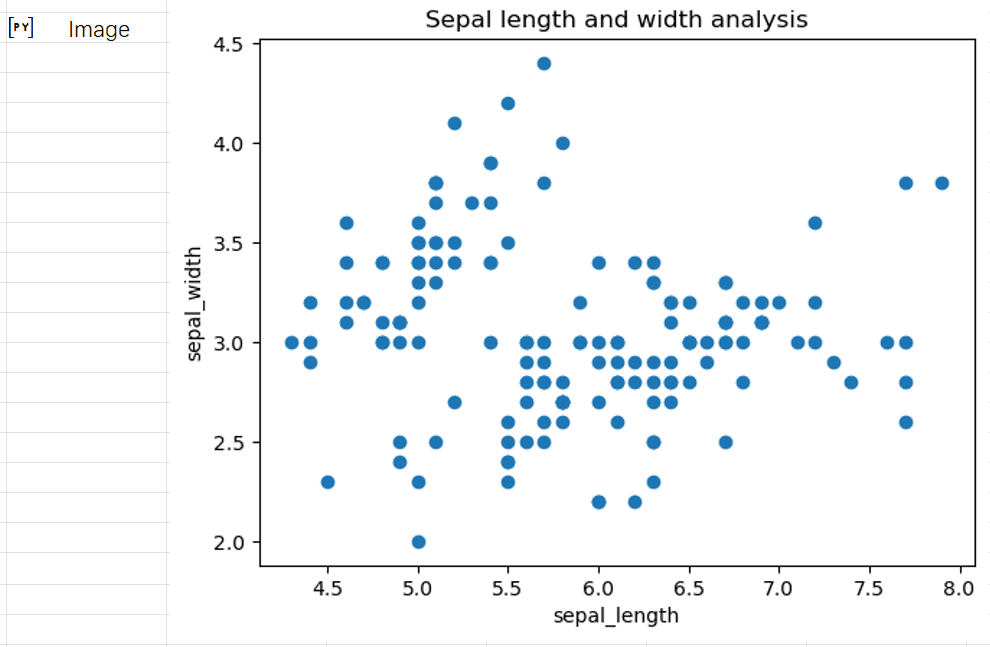
import matplotlib.pyplot as plt
plt.scatter(xl("IrisDataSet10[sepal_length]"), xl("IrisDataSet10[sepal_width]"))
plt.xlabel('sepal_length')
plt.ylabel('sepal_width')
plt.title('Sepal length and width analysis')
Generate images to observe the relationship between variables:
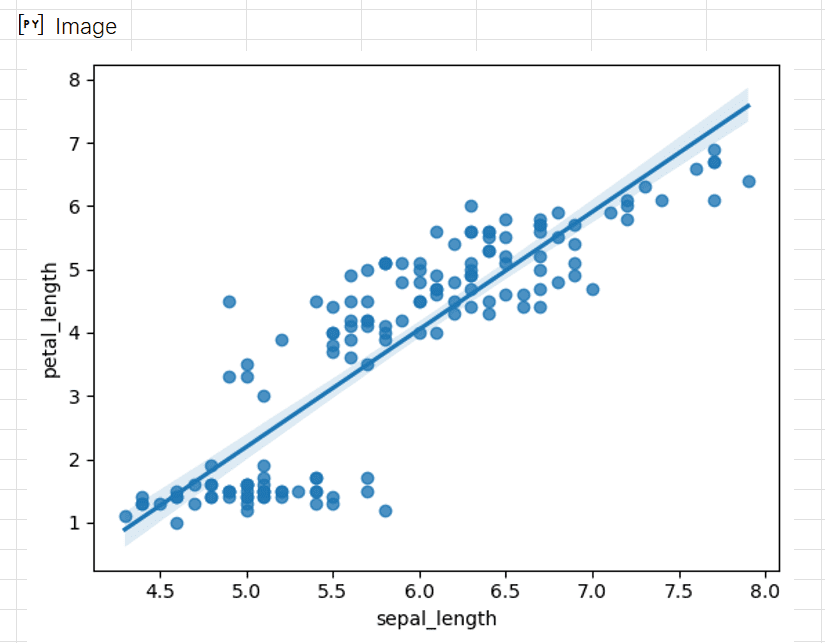
import seaborn as sns
sample_df = xl("IrisDataSet11[#全部]", headers=True)
sns.regplot(data = sample_df[["sepal_length","petal_length"]], x = "sepal_length", y = "petal_length")
Plot to find a linear relationship between a dependent variable and one or more independent variables:
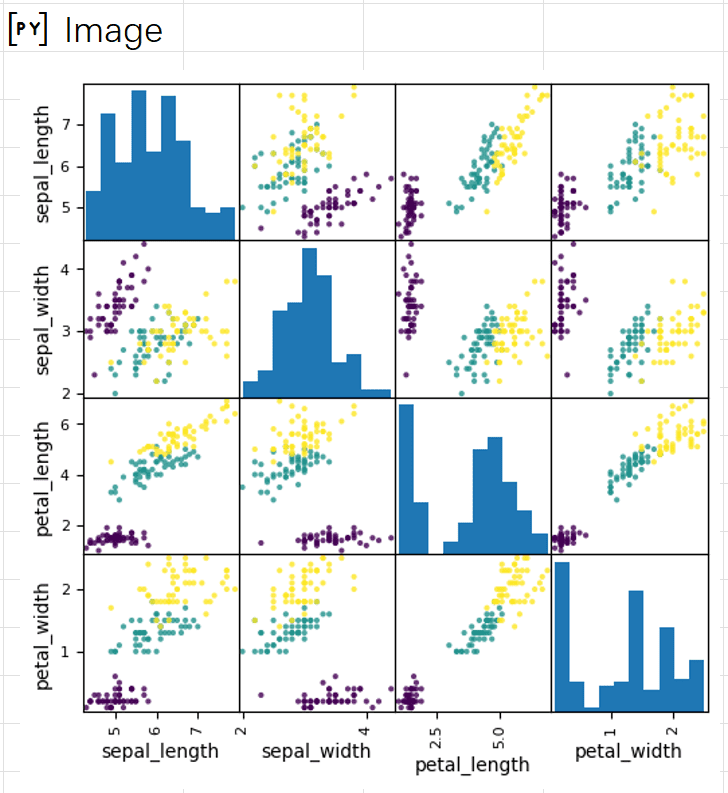
from pandas.plotting import scatter_matrix
sample_df = xl("IrisDataSet13[#全部]", headers=True)
columns_to_plot = ["sepal_length", "sepal_width", "petal_length", "petal_width"]
categories = sample_df["species"].unique()  # Get unique categories
colors = {category: i for i, category in enumerate(categories)}
scatter_matrix(sample_df, c=sample_df["species"].apply(lambda x: colors[x]), figsize=(6, 6), alpha=0.8)
Generate a graph matrix for analyzing the relationships between pairs of variables in a data set:
 If you don't know Python
It doesn't hurt that copilot will help you!
In Excel, click on copilot and a chat box pops up on the right asking copilot to write code for Python to perform linear regression:
And, soon Python in Excel with copilot will be available. At that time, copilot will be directly based on natural language to automatically generate py code and run directly out of the results, directly eliminating the copy and paste modified steps.
Let's expect this to happen!
Many people say, why not just implement it in Python?
My answer is that Python's installation environment alone keeps 90%'s out of the door, and some people will never want to leave Excel for the rest of their lives.
All that's needed to make this happen is a Microsoft 365 Business subscription.
© Copyright notes
Article copyright AI Sharing Circle All, please do not reproduce without permission.
Related posts

No comments...


 Next, the matplotlib library is imported to generate the scatterplot:
 Linear regression statistical modeling was introduced for seaborn:
 Introducing the pandas matrix diagram:
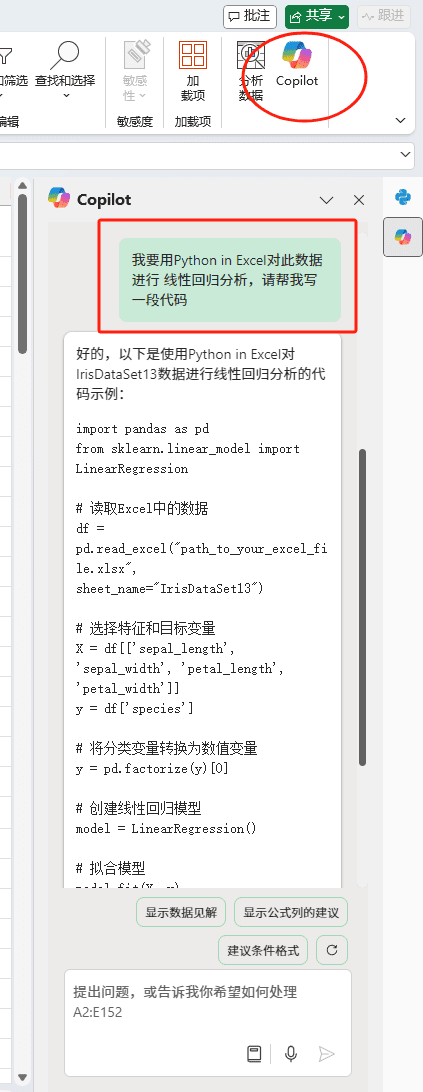 Copy this code into the PY input box and make the appropriate changes as prompted.


