Diagramming AI: Designing UML diagrams and workflow diagrams online using AI
General Introduction
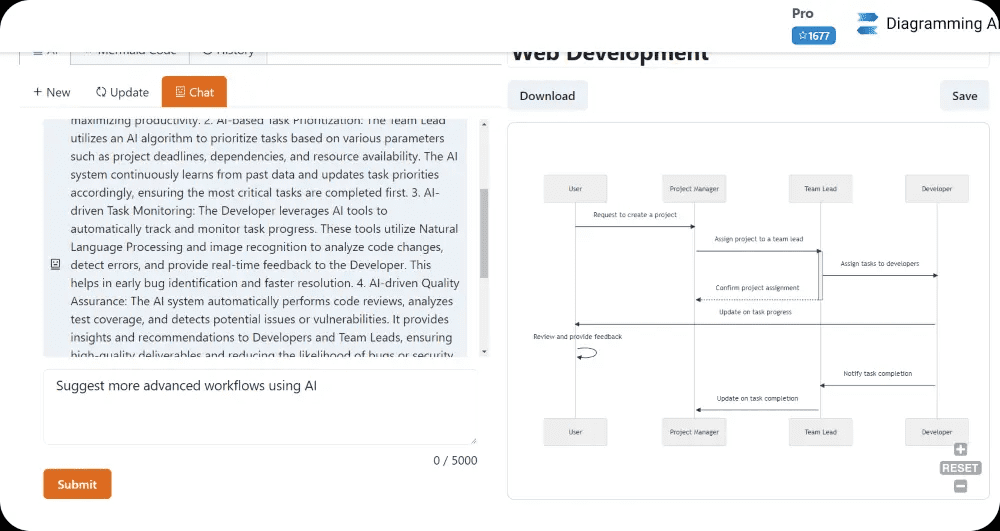
Diagramming AI is a powerful online tool that utilizes artificial intelligence technology to help users instantly design and edit UML diagrams and workflow charts. The site offers a variety of diagram formats, including flowcharts, sequence diagrams, and Gantt charts, and allows users to generate the appropriate diagrams by simply entering text. By interacting with the AI, users can get personalized suggestions and real-time updates, making diagram design easy and efficient. The platform also supports project management with Mermaid, PlantUML and Graphviz code, providing flexible export and editing capabilities to ensure that users' projects are always well organized.

Function List
- AI-driven automated chart generation
- Support for multiple chart formats (flowcharts, sequence diagrams, Gantt charts, etc.)
- AI chat mode for discussion and update suggestions
- Seamless charting experience
- Quick edit function to easily resize and style chart sections
- Project management and code storage with support for Mermaid, PlantUML and Graphviz
- Flexible export and editing capabilities with support for SVG/PNG formats and shareable URLs
- Customizable color themes for rich visual effects
Using Help
AI-driven automated chart generation
- After logging in, enter the description of the chart you want to generate in the Home page input box.
- Click on the "Generate" button and AI will generate a chart according to your description.
- You can choose from different chart formats such as Flowchart, Sequence Chart and Gantt Chart.
AI Chat Mode
- On the chart generation page, click the "AI Chat" button to enter the chat mode.
- Select "Discussion Mode" to discuss with the AI suggested improvements to the chart.
- Select "Update Mode" to send commands directly to the AI to update the chart in real time.
Quick Edit Function
- On the Chart Generation page, click the "Quick Edit" button.
- Use the editing tools provided to resize and style the various parts of the chart.
- When you are done editing, click the "Save" button to save your changes.
Project management and code storage
- Click on the "Projects" button on the home page to go to the project management page.
- Create a new project or select an existing one and use Mermaid, PlantUML or Graphviz code for diagramming.
- After saving your project, you can access and manage your charts at any time.
Exporting and Sharing
- On the chart generation page, click the "Export" button.
- Choose an export format (SVG/PNG) or generate shareable URLs.
- You can download the chart locally or share it with others via URL.
Custom Color Themes
- On the Chart Generation page, click the "Theme" button.
- Select your preferred color theme to apply to the current chart.
- You can choose different color themes to enhance the visual effect of the charts according to your project needs.
With the above steps, you can fully utilize the functions of Diagramming AI to easily create and manage various diagrams and enhance your work efficiency.
© Copyright notes
Article copyright AI Sharing Circle All, please do not reproduce without permission.
Related articles

No comments...


