
Data Formulator: an AI-driven data visualization tool

General Introduction
Data Formulator is an open source AI-driven data visualization tool developed by Microsoft Research. The tool combines a graphical user interface (GUI) and natural language input (NL) to enable users to quickly create and iterate on complex data visualizations through simple interactions and commands.Data Formulator is designed to help data analysts and researchers process and present data more efficiently, improving the efficiency and effectiveness of data analysis. Users can use the tool in a variety of ways including Python package installation and GitHub Codespaces.

Function List
- Data Visualization Creation: Automatically generate rich data visualization charts through AI.
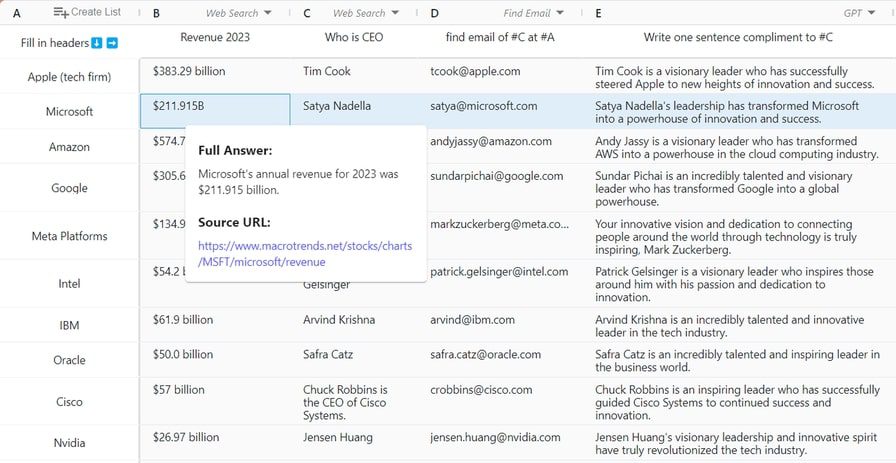
- natural language input: Supports users in describing data visualization needs through natural language.
- graphical user interface (GUI): Provides an intuitive graphical interface to simplify the operation process.
- Data Cleaning: Support for loading images or cluttered text and parsing and cleansing them with AI.
- Python Package Support: It can be installed and run via a Python package for easy local use.
- GitHub Codespaces Integration: Support for quick startup and use in GitHub Codespaces.
- Data visualization challenges: Provide data visualization challenges to help users improve their skills.
Using Help
Installation process
- Installation via Python PIP::
- Run the following command in a terminal to install Data Formulator:
pip install data_formulator- After the installation is complete, run the following command to start Data Formulator:
data_formulator- Data Formulator will automatically open in your browser on port 5000 by default. if the port is occupied, you can specify another port:
python -m data_formulator --port 8080 - Use in GitHub Codespaces::
- The Data Formulator is pre-configured in GitHub Codespaces and can be quickly launched by users!
Functional operation flow
- Creating Data Visualizations::
- After opening Data Formulator, select "New Project".
- Describe data visualization requirements through a graphical interface or natural language input, such as "Create a bar chart showing sales data".
- Data Formulator will automatically generate the appropriate charts based on the inputs and display them in the interface.
- Data Cleaning::
- Select the "Data Cleaning" function in the main interface.
- Upload an image or text file to be cleaned.
- Data Formulator will automatically parse and cleanse the data to produce structured data for subsequent use.
- Participate in data visualization challenges::
- Select "Data Visualization Challenge" from the main screen.
- Follow the prompts to select a challenge and complete the visualization task using the provided dataset.
- Once completed, the results can be shared to the community to communicate and discuss with other users.
© Copyright notes
Article copyright AI Sharing Circle All, please do not reproduce without permission.
Related posts


No comments...