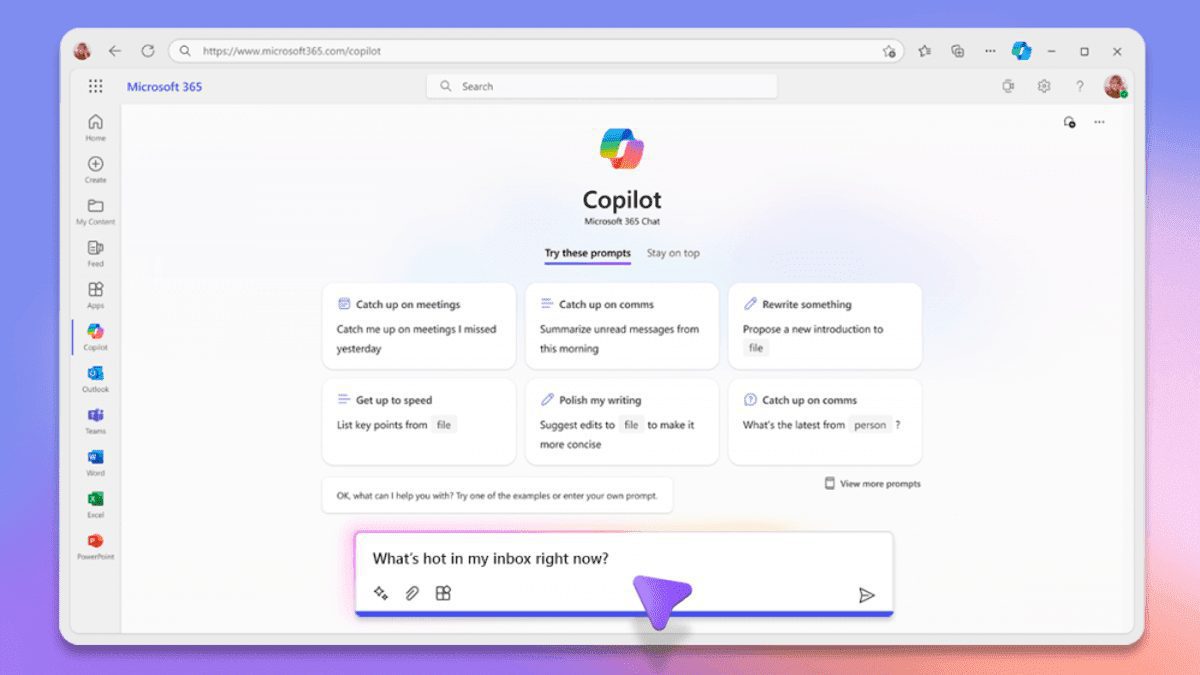
Copilot in Excel with Python Advanced Data Analysis
Finally! ~
Copilot in Excel with Python Advanced Analysis
Python Advanced Data Analysis in Excel is finally available.

Waiting for this button has been a week, last week Microsoft released this new feature, excited to no end. But back to their own computers, how to toss can not be tossed out, back and forth and Microsoft technical support docked the actual email, they checked the realization of the program.
Copilot in Excel with Python Advanced Analysis
Python Advanced Data Analysis in Excel is finally available.
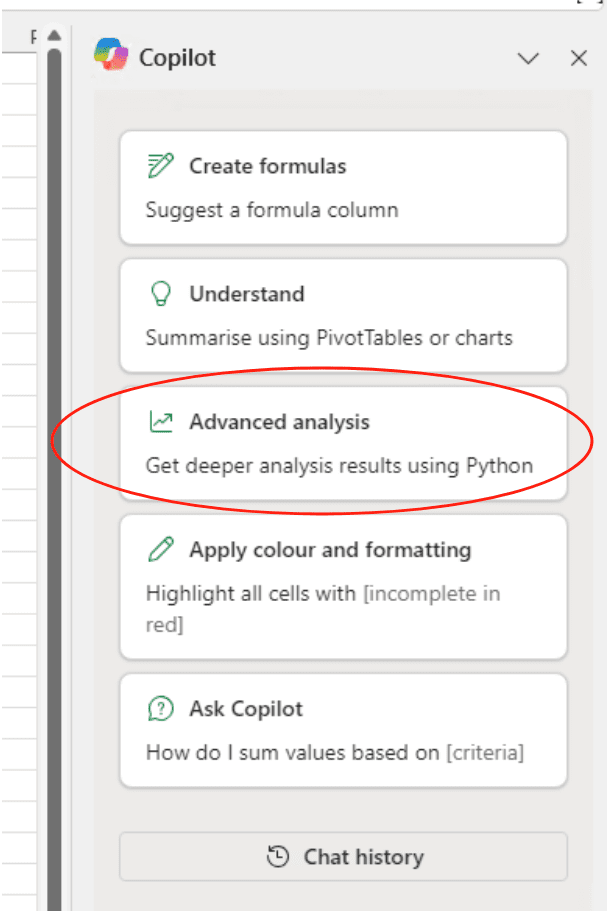
Waiting for this button has been a week, last week Microsoft released this new feature, excited to no end. But back to their own computers, how to toss can not be tossed out, back and forth and Microsoft technical support docked the actual email, they checked the realization of the program.
Without further ado, catch a glimpse of the real thing.
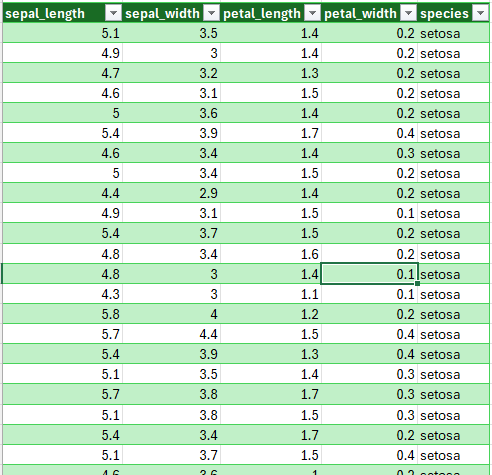
First, there's the data:
Click on the "advanced analysis" button in the right-hand copilot pane, and a line will automatically be entered below asking for a deep advanced analysis using Python: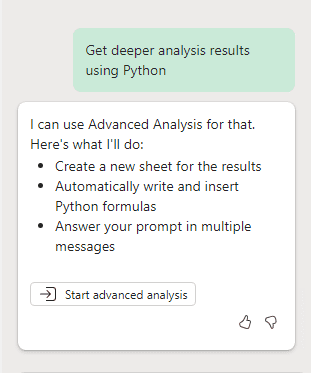
copilot will call Python to create code and generate images directly from the data:
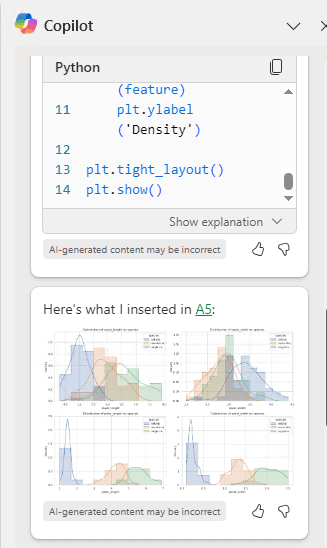
Results Showcase: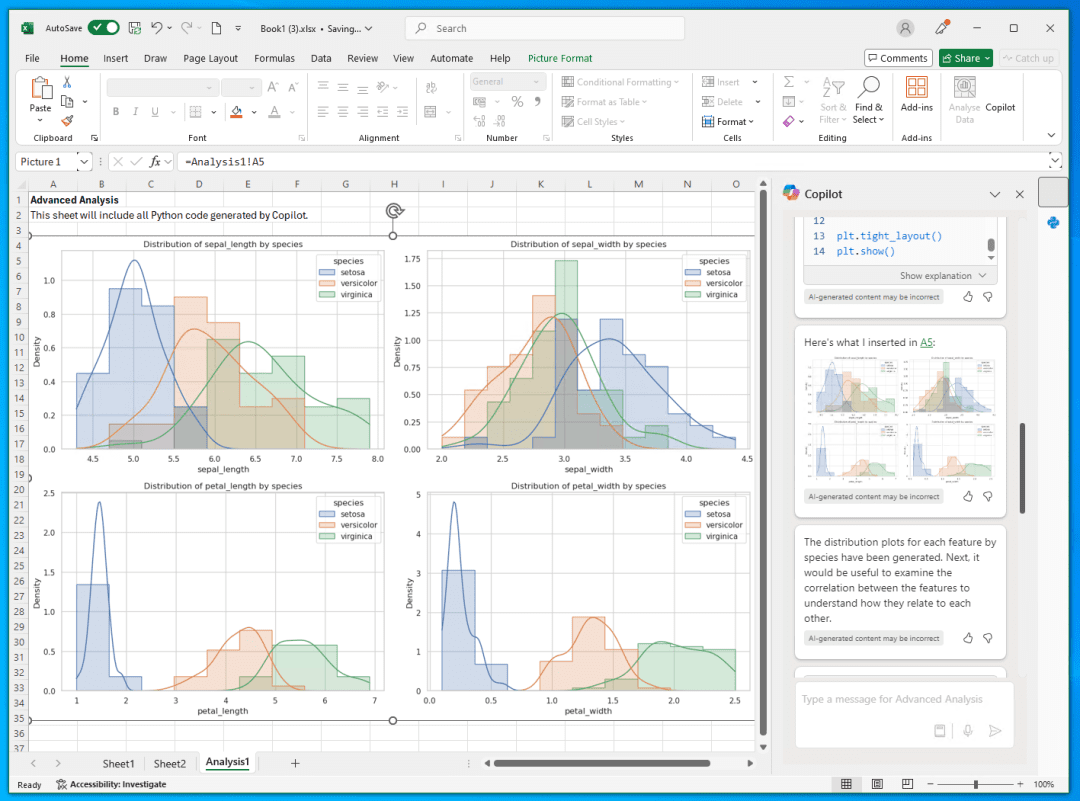
When I asked it to draw a bar graph in Chinese, it made it clear that if you use the Python function in copilot for advanced data analysis, you can only use English:

So I adjusted my language a bit and got results quickly:

into graphical results:
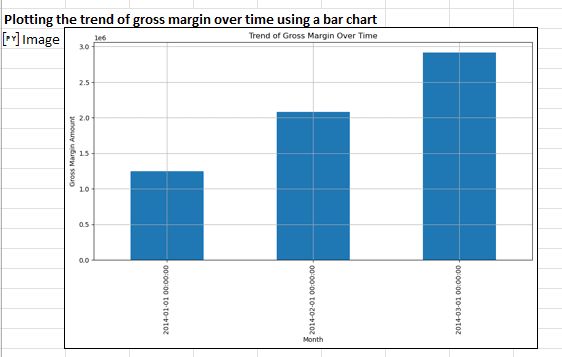
Conditions of use
Subscribe to Copilot for Microsoft 365 for Business, Windows, US IP, computer region set to US, Windows and office language adjusted to English, join Microsoft 365 Preview program.
The conditions are extremely harsh.
However, if you know the Python language yourself, you can call the Python component directly for graphing or analyzing, and all you need is a Microsoft 365 Business Edition account.
Or just use copilot and call Excel's own functions for data processing via natural language.
There's always one for you.
© Copyright notes
Article copyright AI Sharing Circle All, please do not reproduce without permission.
Related posts

No comments...

