ChartAI - AI data analysis tool that intelligently recommends suitable chart types

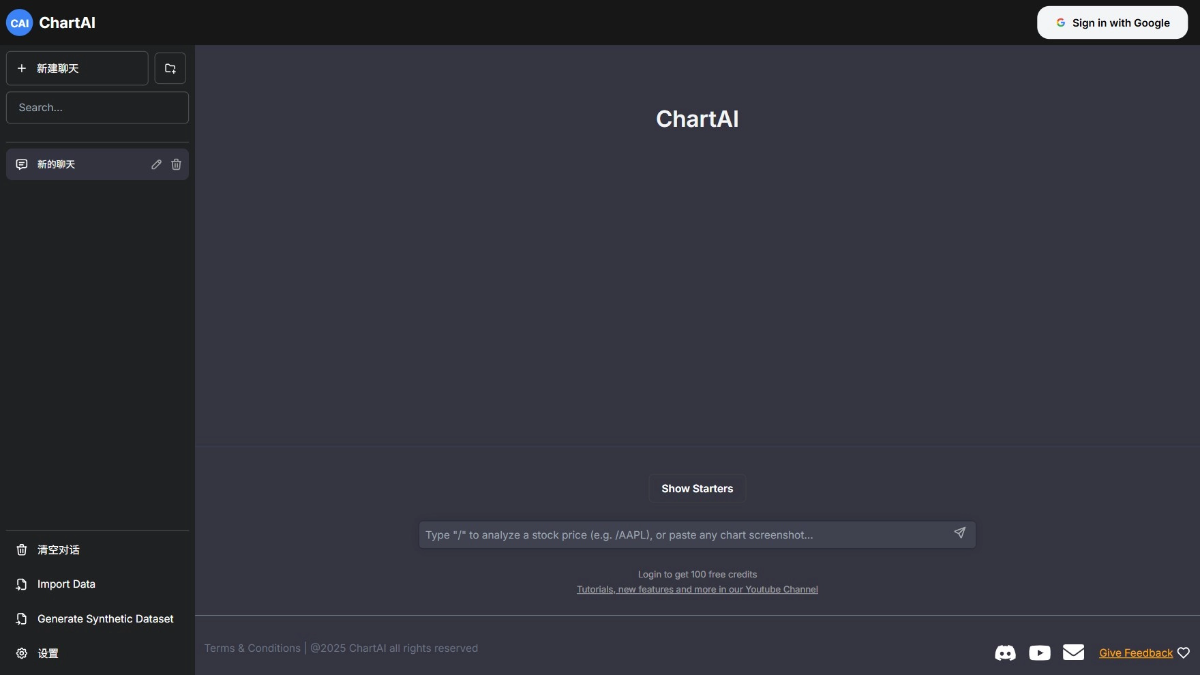
What is ChartAI?
ChartAI is an efficient data visualization tool that automatically analyzes data based on AI technology and generates intuitive charts to help users quickly understand complex information.ChartAI supports the import of multiple data formats (e.g., Excel, CSV), and intelligently suggests the most suitable chart types, such as bar charts, line charts, pie charts, etc. Users can customize the charts according to their needs by adjusting the style, color, font, etc. ChartAI provides interactive analysis functions that support zooming, filtering, and hovering operations. Users can customize the charts according to their needs, adjusting the style, color and font, etc. ChartAI provides interactive analysis functions, supporting zooming, filtering and hovering operations, which is convenient for users to explore the data in depth. Based on AI analysis, the tool provides trend forecasts and key insights to help users make more informed decisions.
Key Features of ChartAI
- Smart Chart Recommendations: Automatically analyze data characteristics and recommend the most suitable visualization chart types, such as bar charts, line charts, pie charts and so on.
- Personalization: Support users to freely adjust the style, color, font and layout of charts to meet individual needs.
- Interactive Analysis: Supports operations such as zooming, filtering, and hovering to help users explore the details of the data in depth.
- Data trend forecasting: Analyze data based on AI technology to provide trend forecasts and key insights to aid decision-making.
- Multi-format export and sharing: Support for exporting charts to PDF, PNG, etc., or sharing them directly online for easy reporting and collaboration.
- Multi-platform support: Desktop and mobile compatible, easy to view and edit charts on the go.
ChartAI's official website address
- Official website address:: https://chartai.io/
How to use ChartAI
- Register Login: Visit the official ChartAI website at https://chartai.io/ and follow the instructions to complete registration and login.
- Import data: Upload local Excel or CSV files, or import cloud data based on links (e.g. Google Sheets).
- Generate Charts: After uploading the data, ChartAI automatically analyzes the data and recommends the most suitable chart type (e.g., bar chart, line chart, pie chart, etc.), and the user manually selects other chart types according to their needs.
- Customized Charts: Adjust the chart's color, font, title, legend and other styles to optimize the chart's visual effect according to your needs.
- interactive analysis: Explore data details in depth and locate key information quickly with chart-based zooming, filtering, hovering, and more.
- Get Insights: View predictions of data trends and key insights based on AI technology to help users better understand the meaning behind the data and aid decision-making.
- Export SharingExport charts to PDF, PNG, SVG and many other formats, or generate online links to share with colleagues or clients for easy collaboration and reporting.
- Multi-platform use: Support desktop and mobile access, users can view and edit charts anytime, anywhere, to meet the needs of different scenarios.
ChartAI's Core Benefits
- Efficient automation: Automatically identify data characteristics to generate the most suitable visualization charts, greatly saving the user time to select and design charts, suitable for novices to get started quickly.
- AI-driven deep insights: Based on AI technology, it provides data trend predictions and key insights to help users discover the patterns and potential problems behind the data and assist in smarter decision-making.
- user friendliness: The interface is simple and intuitive, and the operation process is straightforward, so both novices and professionals can quickly master it, reducing learning costs and enhancing user experience.
- Powerful FlexibilityProviding rich customization options, users can adjust the style, color and layout of charts according to their needs to meet the personalized needs in different scenarios.
- Increased interactivity: Supporting interactive operations such as zooming, filtering, and hovering, users can explore the details of the data in depth, quickly locate key information, and enhance the depth and efficiency of data analysis.
- Multi-platform compatibility: Support desktop and mobile access, users can view and edit charts anytime, anywhere, to meet the needs of different scenarios.
Who ChartAI is for
- Data Analyst: Quickly transform complex data into intuitive charts and graphs, extract trends and insights, and improve analytical efficiency.
- Business professionals: Visualize sales, financial and other data to assist management in decision-making and generate professional reports.
- Market researchers: Demonstrate market trends and consumer preferences to quickly extract key information to support strategy development.
- Project managers: Monitor project progress, identify problems in time through charts and improve management efficiency.
- Educators and students: Visualize instructional or research data to facilitate teaching and understanding and enhance learning.
© Copyright notes
Article copyright AI Sharing Circle All, please do not reproduce without permission.
Related articles


No comments...