BrowserTools MCP: MCP service for real-time monitoring of browser activity
General Introduction
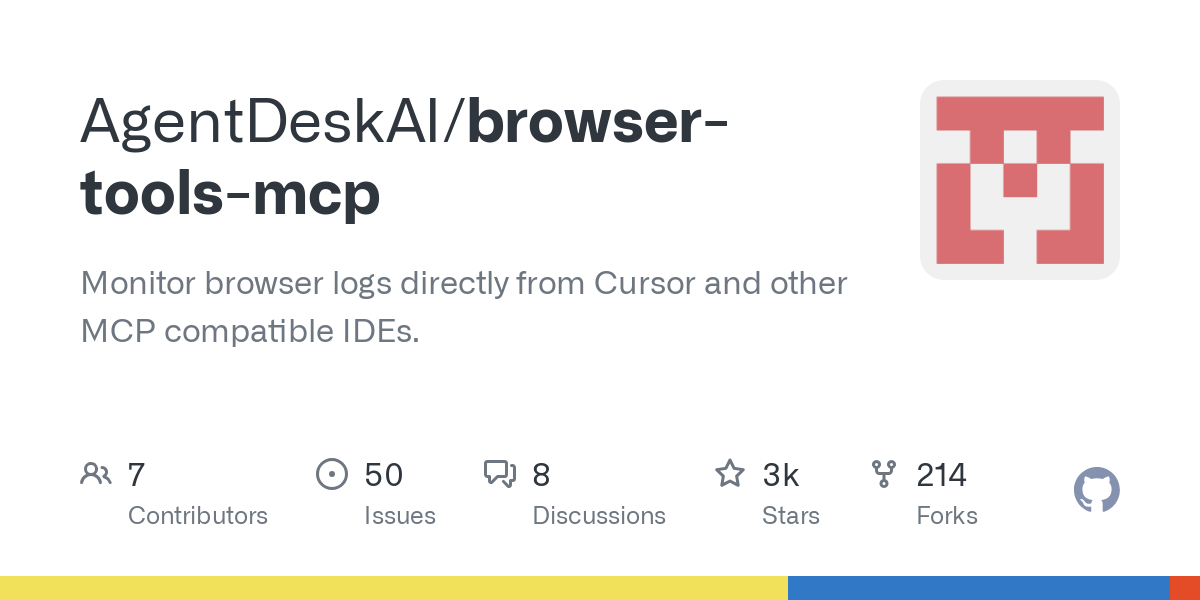
BrowserTools MCP is an open source project developed by the AgentDeskAI team. It uses Chrome extensions and Node.js services to enable AI to monitor browser activity in real time, including logs, network requests and screenshots, and also analyze web performance, SEO and accessibility. The project is based on Anthropic MCP protocol, suitable for use with Cursor The latest version 1.2.0 was released in February 2025 and has 2400+ stars on GitHub. The latest version, 1.2.0, was released in February 2025 and has 2400+ stars on GitHub. It's simple and practical, especially for developers debugging web pages or optimizing websites, and all data is stored locally only, without involving third-party services.

Function List
- Capture browser console logs in real time to locate code problems.
- Monitor network requests for request status and errors.
- Capture the current web page screen, save or paste it into the editor.
- Analyze web page DOM elements to extract specific data.
- Perform a performance audit to discover the cause of slow loading.
- Check SEO optimization and provide suggestions for improvement.
- Runs accessibility audits and is WCAG compliant.
- Support for NextJS project auditing to optimize framework issues.
- Provides debug mode to run all debugging tools in sequence.
- Provides an audit mode that runs all audit tools in sequence.
Using Help
BrowserTools MCP requires three components to run: the Chrome extension, the Node server, and the MCP server. Below is a detailed installation and usage guide to make sure you can get started quickly.
Installation process
- Install Chrome Extension
- Download the extension from https://github.com/AgentDeskAI/browser-tools-mcp/releases/download/v1.2.0/BrowserTools-1.2.0-extension.zip.
- Extract the ZIP file to a local folder.
- Open Chrome and go to
chrome://extensions/The - Turn on "Developer Mode" and click on "Load Unpacked Extension".
- Select the extracted folder and make sure the extension appears in the list.
- Running the Node server
- Make sure Node.js is installed on your computer (18+ recommended).
- Open a terminal and run it:
npx @agentdeskai/browser-tools-server@latest - Seeing "Server running on port 3025" indicates successful startup.
- If there is a port conflict, close the occupying process and retry.
- Configuring the MCP server (Cursor for example)
- Open Cursor and go to Settings > MCP.
- Click Add New Global MCP Service.
- compiler
~/.cursor/mcp.json, add:{ "mcpServers": { "browser-tools-mcp": { "command": "npx", "args": ["@agentdeskai/browser-tools-mcp@latest"] } } } - After saving and refreshing the settings, a green dot indicates a successful connection.
Operation of the main functions
- Monitoring Console Logs
- Open the target web page and press F12 to access the developer tools.
- Click "Connect" in the "BrowserToolsMCP" panel.
- Logs are displayed in real time and can be saved locally by clicking "Save Logs".
- Capturing Web Requests
- View the request details in the Network tab.
- In the Cursor input
mcp_getNetworkLogsGet all requests, ormcp_getNetworkErrorsView error request.
- screen capture
- Set the save path in the Extensions panel (default)
/mcp-screenshots). - Click "Take Screenshot" to save the screenshot.
- When "Allow Auto-Paste into Cursor" is enabled, the screenshot is automatically pasted with the Cursor input box in focus.
- Set the save path in the Extensions panel (default)
- Running the audit tool
- Make sure the extension is enabled and has active pages.
- Enter the following command at Cursor:
runAccessibilityAudit: Check for accessibility (WCAG).runPerformanceAudit: Analyze performance bottlenecks.runSEOAudit: Optimize for SEO.runBestPracticesAudit: Check for best practices.runNextJSAudit: Audit of the NextJS project.runAuditMode: Run all audits sequentially.runDebuggerMode: Run all debugging tools in sequence.
- The results are returned in JSON format with the score and question details.
- Commissioning mode versus audit mode
- importation
runDebuggerMode, run the debugging tools in sequence to help locate the problem. - importation
runAuditMode, run the audit tool in sequence to detect all optimization points. - The NextJS project automatically recognizes and additionally runs relevant audits.
- importation
caveat
- Only open one developer tool window, multiple openings may lead to data confusion.
- Restarting the service or refreshing the page will clear the log, so it is recommended to save it in advance.
- Contact @tedx_ai (Platform X) or see https://browsertools.agentdesk.ai/ for documentation if you have questions.
These steps allow you to take full advantage of the power of BrowserTools MCP to improve your web development efficiency.
application scenario
- web debugging
Developers use it to monitor logs and networks to quickly find code errors. - Website Optimization
Analyze performance and SEO to improve user experience with audit tools. - AI development support
AI developers incorporate Cursor to optimize smart applications using real-time data.
QA
- Why doesn't the log show up?
Verify that the extension and server are connected, and check that the developer tools window is not opened more than once. - Where are the audit results viewed?
After running the command in an MCP client such as Cursor, the results are returned in JSON format. - Are other browsers supported?
Currently only Chrome is supported, with possible extensions in the future.
© Copyright notes
Article copyright AI Sharing Circle All, please do not reproduce without permission.
Related articles

No comments...


