Austen: an AI tool that analyzes book character relationships and generates graphs
General Introduction
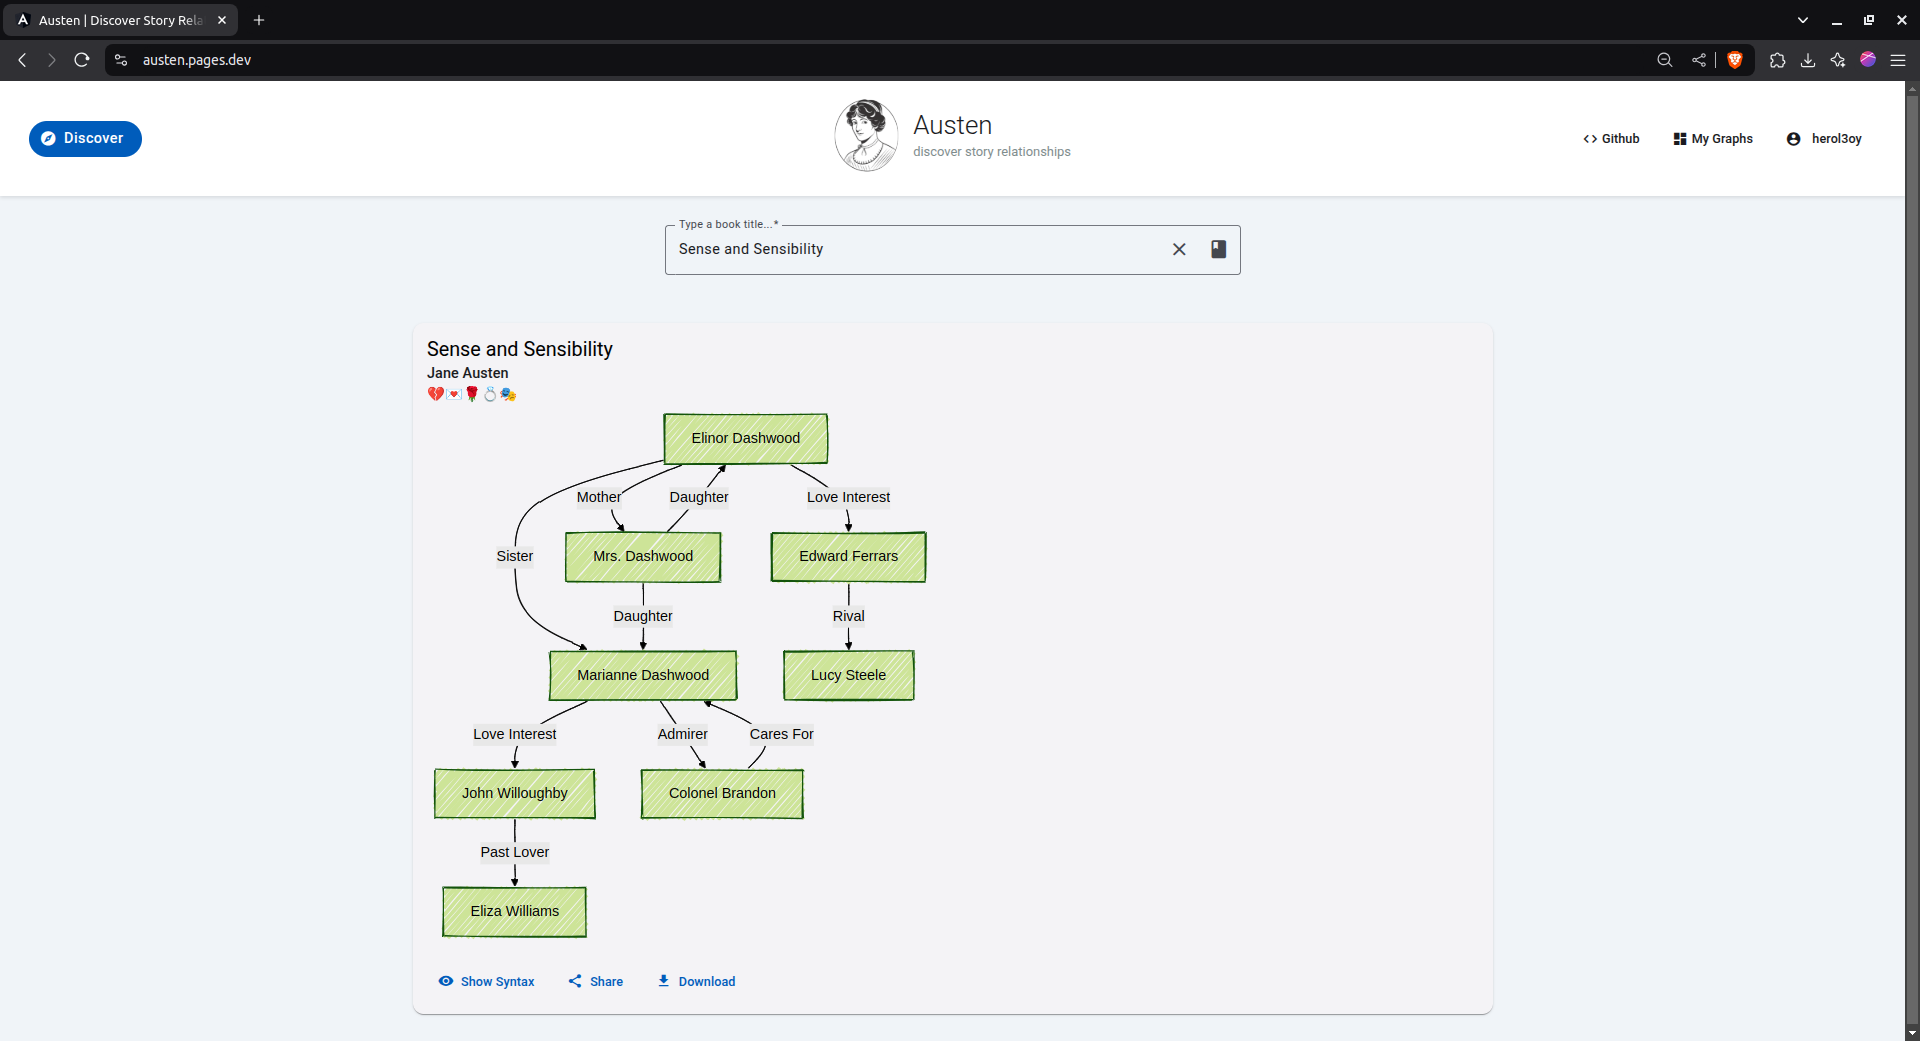
Austen is an open source AI tool that uses the Angular framework and Analogjs initialization, combined with Mermaidjs technology to generate charts that help users analyze character relationships in books. Users can enter the name of the book in the Open Library, Austen will automatically generate a visual character relationship diagram through AI, and support for saving, sharing and downloading. The tool is suitable for literature enthusiasts, students, or developers, and the project is completely free, hosted on GitHub, so anyone can participate in improving it.

Function List
- Search and analyze books: Supports searching any book from Open Library and performing character analysis.
- AI-driven character relationship extraction: Using AI technology to automatically recognize characters and their relationships in books.
- Generating Mermaidjs Charts: Translate the results of the analysis into visual relationship diagrams.
- Save and download charts: The generated charts can be saved to a database and downloaded in SVG or PNG format.
- Public or private sharing: Users have the option of making the chart public for others to view, or keeping it private.
- Browse other people's charts: View diagrams made public by other users on the Discover page.
- Like feature (under development): In the future, favorite charts can be liked or un-liked.
Using Help
Austen requires a local installation to run and there is currently no online version. Below is a detailed installation and usage guide to get you started.
Installation process
- Download Project Code
Clone the project locally by entering the following command in the terminal:
git clone https://github.com/herol3oy/austen.git
Then go to the project directory:
cd austen
- Installation of dependency packages
Use npm to install the required packages:
npm install
- Configuring Environment Variables
Copy the example file and rename it.env::
cp .env.example .env
show (a ticket) .env file, fill in the following information:
DEEPSEEK_API_KEY: from DeepSeek The API key obtained by registering on the official website.VITE_PUBLIC_SUPABASE_URL: URL of the Supabase project.VITE_PUBLIC_SUPABASE_ANON_KEY: The anonymous key for Supabase.
If desired, the OpenAI key can also be configured (optional).
- Setting up the Supabase database
- Visit https://supabase.com to create a new project.
- Enable authentication (Authentication).
- Created under public schema
graphstable with the following fields:id(uuid, primary key)book_name(text, not empty)author_name(text, not empty)svg_graph(text, not empty)mermaid_syntax(text, not empty)emojis(text, optional)user_id(uuid)is_public(boolean, default false)created_at(timestamp)
After saving, fill in the project URL and anonymous key in the.envThe
- Starting the Local Server
Enter the following command to run the project:
npm run dev
Open your browser and visit http://localhost:5173(Ports may vary by configuration).
- Deployment to production environments
If you want to deploy to a server, run it:
npm run build
Once built, it can be uploaded to platforms such as Cloudflare Pages.
How to use the main features
- Generate Role Relationship Diagram
Once launched, enter the book title and author (e.g. "The Wizard of Oz" by L. Frank Baum) on the first page. Click "Generate" and the AI analyzes the book's content and displays a Mermaidjs chart after a few seconds. The chart shows the relationships between characters, such as Dorothy and Toto's "pet" relationship. - Save and download charts
After generating the chart, click the Save button and the data will be stored to Supabase. you can download the chart as SVG or PNG format for easy sharing or printing. - Share Chart
On the My Diagrams page, find the diagram you created. Select the "Public" option so that other users can see it on the "Discover" page. If you don't want to share it, just keep it private. - Browse other people's charts
On the "Discover" page, you can view diagrams that other users have made public. For example, someone has shared a character relationship chart for Pride and Prejudice, which you can enjoy directly. - Like feature (to be implemented)
The current version doesn't have a like button yet. The developers plan to add "like" and "unlike" features, after which you will be able to vote for your favorite charts.
Example of operation flow
Want to analyze The Wizard of Oz? Try this step-by-step:
- Enter the title "The Wizard of Oz" and the author "L. Frank Baum" on the first page.
- Click "Generate" and wait a few seconds.
- Check out the charts: Dorothy is the centerpiece, with connections to Toto, Scarecrow, and more.
- Click "Save" and select "Public".
- Go to the My Diagrams page to download the SVG file, or check the Discover page for feedback from others.
Technical details
- The interface is based on Angular Material, which is beautiful and easy to use.
- Charts are drawn by Mermaidjs and support custom theme colors.
- AI analysis relies on DeepSeek or OpenAI to ensure accurate results.
application scenario
- Literary studies
Enthusiasts can use Austen to analyze the network of characters in Jane Eyre and visualize the relationship between Jane and Rochester. - classroom teaching
The teacher generates a Harry Potter chart to help students understand the friendship of Harry, Ron, and Hermione. - Technical Learning
Developers can study the code and learn how to build similar tools with Angular and Supabase.
QA
- What books are supported?
Any book for which Open Library has data is fine, such as Pride and Prejudice, The Wizard of Oz. - Can charts be edited?
The current version does not support direct editing, but you can modify the Mermaidjs code and regenerate it. - Do I have to pay for it?
No need, the program is completely free. But running it requires configuring the API key and Supabase yourself. - Why use Supabase?
It is responsible for storing chart data, supporting public sharing and user management.
© Copyright notes
Article copyright AI Sharing Circle All, please do not reproduce without permission.
Related posts

No comments...


