arXiv Paper Visualizer: arXiv Paper Recommendation and Visual Interpretation
General Introduction
arXiv Paper Visualizer is an online tool focused on helping users quickly understand and screen academic papers on the arXiv platform. It uses artificial intelligence technology to transform complex paper content into intuitive visualization forms, enabling researchers and academic enthusiasts to grasp the core ideas of papers more efficiently. The website's main feature is to analyze daily updated arXiv papers through AI to provide personalized recommendations and visual interpretations, which is especially suitable for users who need to quickly get research inspiration or track academic frontiers. Whether scholars in physics, computer science or other fields, this tool can significantly reduce the time cost of reading and screening papers, helping research work more efficient.
Function List
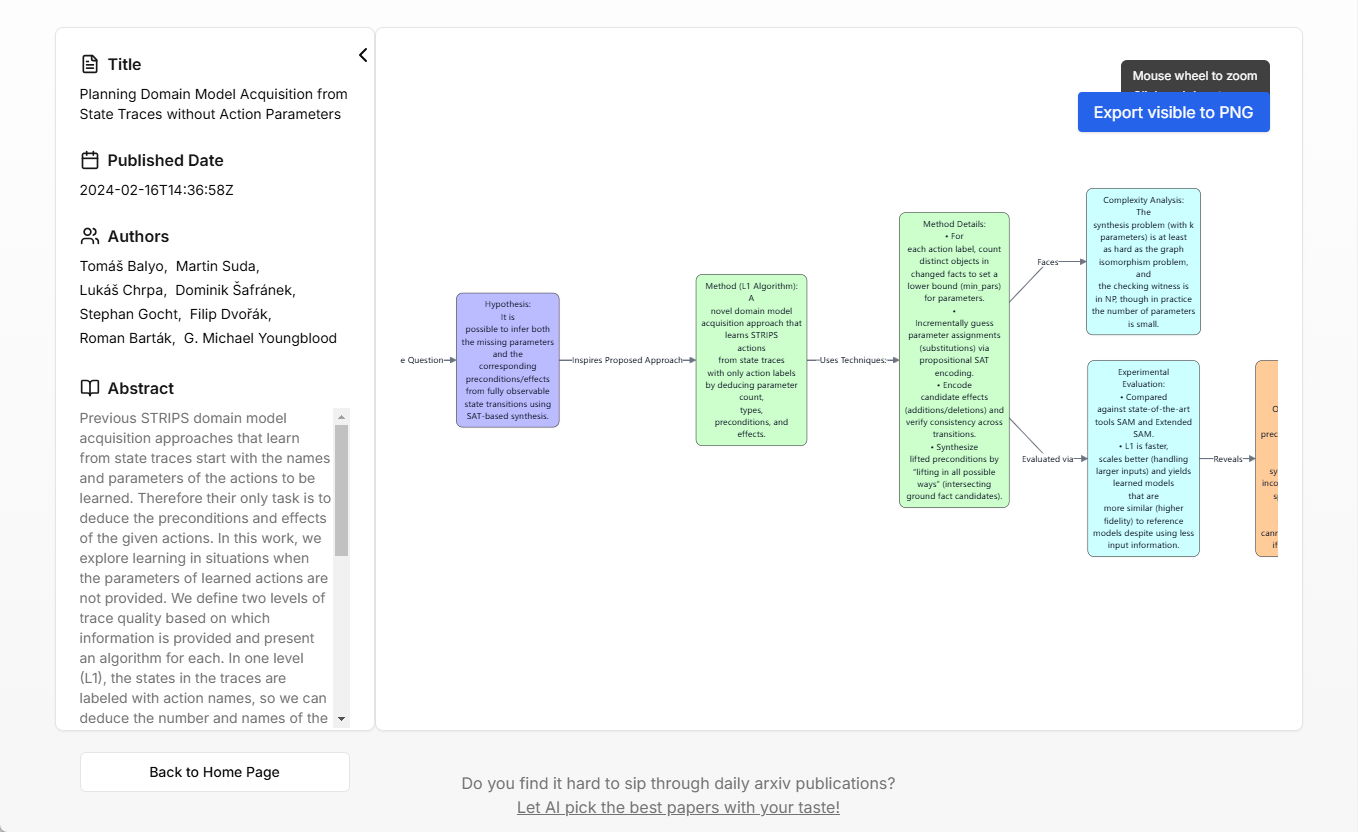
- Thesis Visualization Interpretation: Convert arXiv papers into charts or visual summaries to quickly present the core of the research.
- AI Intelligent Recommendation: Recommends the most relevant papers in the daily arXiv based on user interests.
- Personalized Filtering: Supports filtering of papers by discipline, keyword or research direction.
- History essay retrospective: Demonstrate citation relationships and developmental lines between papers to help users understand the context of the research.
- Multidisciplinary support: Covering a wide range of arXiv-indexed fields such as physics, mathematics, computer science, biology, and more.
Using Help
How to get started
- Access to the website: Open your browser and enter the URL "https://arxiv-viz.ianhsiao.xyz/" to go to the homepage.
- Browse homepage functionOnce you enter, you will see a simple interface, usually with a navigation bar at the top, displaying the main functional entrances such as "Visualization" and "Recommendations".
- No need to register to experience: Some basic features of the current website can be used without logging in, but if you need to save personalized settings, it is recommended that you register for an account (if the website offers this option).
Main function operation flow
1. Visual interpretation of the paper
- Step 1: Selecting a Thesis
Enter the title, keywords or arXiv number (e.g. "1905.04616") of the paper you are interested in in the homepage input box and click the "Search" button. - Step 2: Generate visualizations
The system automatically loads the dissertation data and generates visualizations, usually in the form of charts, mind maps, or timelines showing key points of the dissertation. The wait time is typically a few seconds to a minute, depending on the complexity of the paper. - Step 3: Interpreting the results
The generated visualization highlights the research methodology, conclusions, and citation relationships of the paper. You can click on the nodes in the diagram to see detailed explanations of specific passages.
2. AI Intelligent Recommendation
- Step 1: Setting Interests
On the "Suggestions" page, enter your research area (e.g. "Machine Learning") or keywords and click "Submit". - Step 2: Get a referral list
The system will filter papers related to your interests based on arXiv's daily updates and display them sorted by relevance. - Step 3: Browse and Save
Click on the title of a recommended paper to jump to the original arXiv article, or view the brief analysis directly within the site. Some papers are also available for direct PDF download.
3. Personalized screening
- Step 1: Enter screening mode
Find the "Filter" option on the homepage or sidebar and click on it. - Step 2: Setting Conditions
Select a subject (e.g., "Computer Science"), a time frame (e.g., "Last Week"), or a keyword and click "Apply". - Step 3: View Results
The system produces a list of eligible papers, each accompanied by an introduction and a visual preview.
4. Tracing of historical papers
- Step 1: Enter the target paper
In the "Trace" or "Citation Analysis" function, enter the number or title of a paper. - Step 2: Generate a relationship diagram
The system displays the citation network of the paper, including which papers it is cited by and the earlier studies it cites. - Step 3: Deeper Exploration
Click on a node in the relationship graph to jump to the arXiv page of the relevant paper or view its visualization.
Handling tips and precautions
- refresh frequency: The website is synchronized with arXiv updates in real time and it is recommended to visit daily for the latest recommendations.
- network requirement: As it involves AI processing, it is recommended to use it in a stable network environment to avoid interruptions that may cause the result generation to fail.
- Interaction Optimization: Visual charts support zooming and dragging, and hover to see more details.
- Multi-language support: Currently in English, the original paper and analysis are in English, suitable for users with some English ability.
In-depth experience of featured functions
Personalized Experience with AI Recommendations
AI recommendations are constantly optimized based on the keywords entered by users and historical browsing records. For example, if you type "deep learning", the system will prioritize the delivery of related papers and adjust the recommended content in combination with the current academic hotspots. After long-term use, the accuracy of recommendations will be significantly improved.
Efficiency gains from visualization
Visualizing a paper reduces comprehension time by up to 1/3 compared to reading a full paper. charts and graphs, which usually include the three core parts of a research hypothesis, experimental results, and conclusions, are intuitive and clear, and are particularly suitable for quickly assessing the value of a paper.
Frequently Asked Questions
- Q: What if the visualization results are inaccurate?
A: Due to the possible limitations of AI analysis, if you find that the results are biased, you can try to change the keywords or contact the website directly for feedback (if there is a feedback channel). - Q: Does it support mobile?
A: The site is compatible with mobile browsers, but computer use is recommended for the best visualization experience. - Q: Are the data sources reliable?
A: All data comes directly from arXiv to ensure the authority and real-time nature of the content.
With the above steps and tips, you can easily get started with arXiv Paper Visualizer and enjoy the improved research efficiency brought by AI!
© Copyright notes
Article copyright AI Sharing Circle All, please do not reproduce without permission.
Related articles

No comments...

