Visprex: fast visualization of CSV files, automatically generate all kinds of analytical charts from the data, and process the data completely in the browser.
General Introduction
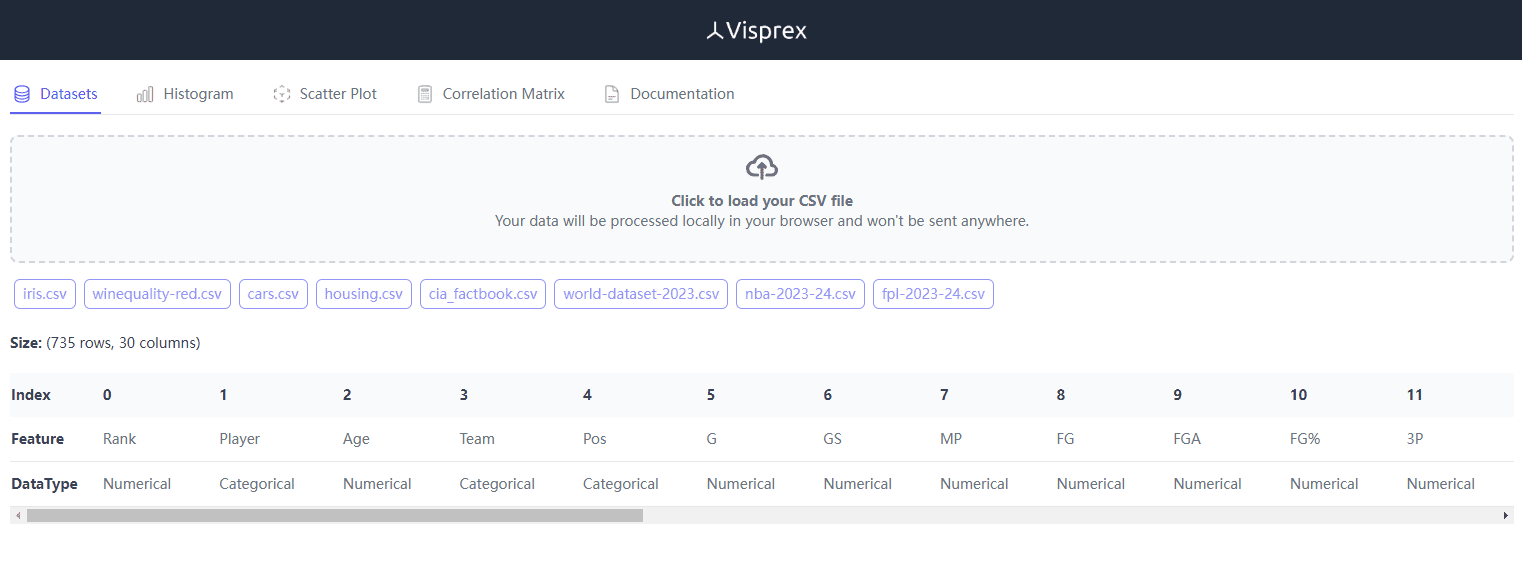
Visprex is a lightweight data visualization tool designed to help users analyze and present data quickly and intuitively. The tool runs entirely in the browser, ensuring data privacy and security, and does not send data to any backend servers.Visprex supports a wide range of data transformation and visualization methods, making it suitable for students, data scientists and analysts.

Online demo: https://www.visprex.com/

Function List
- Data loading: Supports fast loading and parsing of native CSV files.
- data processing: Automatically categorizes data into category type or numeric type.
- bar chart: Show data distribution, support multiple distribution types (e.g., Gaussian, uniform, etc.).
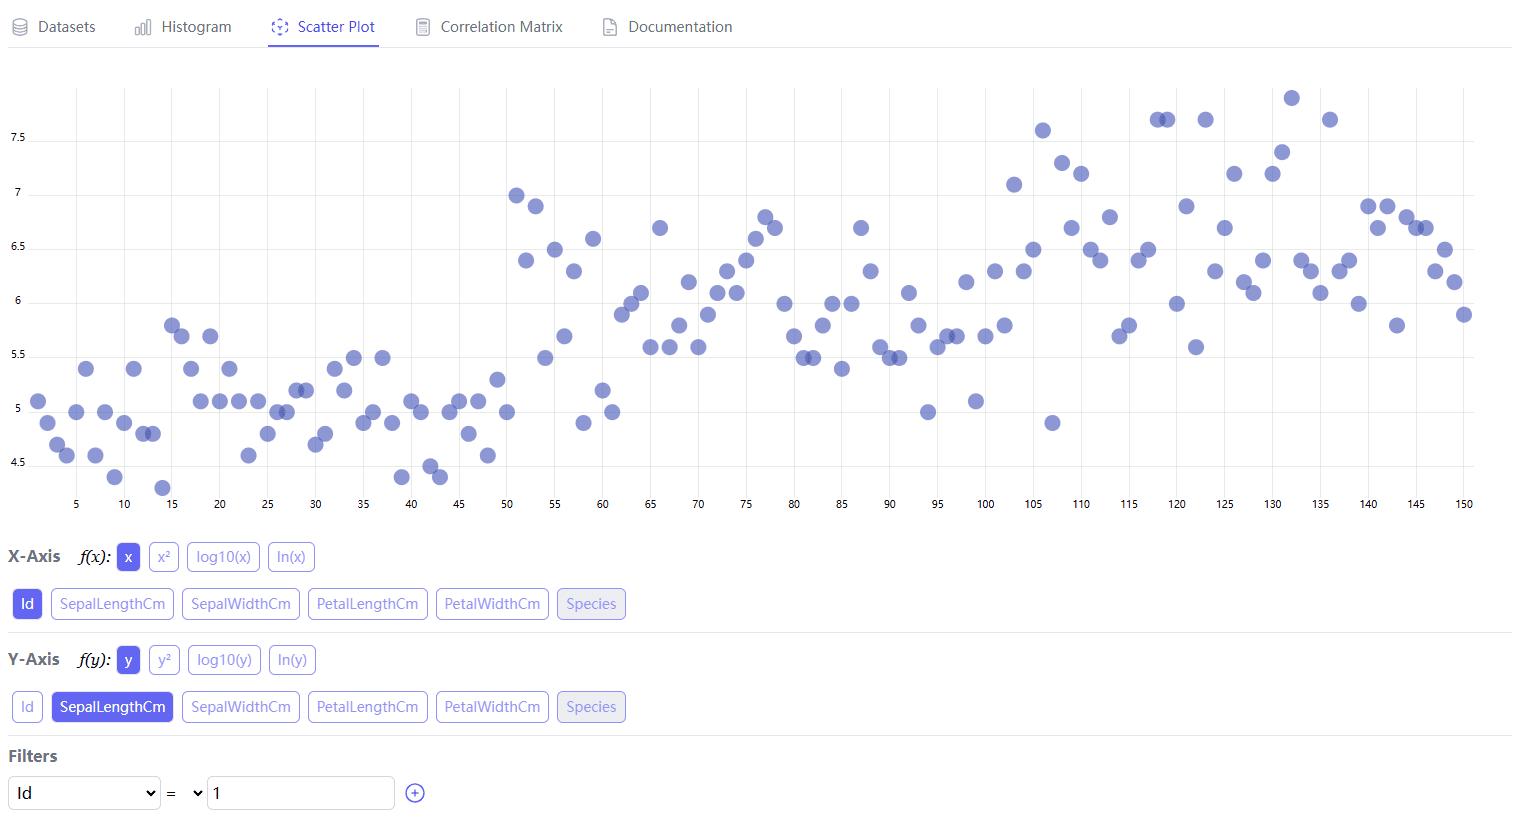
- scatterplot: Select two variables for 2D scatterplot display, support adding filters.
- correlation matrix: Demonstrate linear correlations between variables, with colors distinguishing between positive and negative correlations.
- data conversion: Multiple data conversion methods (square, natural logarithm, log10) are built in.
- open source: The code is completely open source, and users are free to view and modify it.
Using Help
Installation and startup
Visprex is an online tool that requires no installation. Users can simply visit the official Visprex website or GitHub page to get started. Below are the detailed steps on how to use it:
- access page: Open your browser and visit the Visprex GitHub page.
- Load data: Click the "Load Data" button on the page and select a local CSV file to upload.
- data parsing: Once the file is uploaded, Visprex automatically parses the data and categorizes it as either category or numeric.
- Select chart type: Select chart types such as histograms, scatter plots, or correlation matrices as needed.
- Data Display: After selecting the chart type, Visprex automatically generates the corresponding chart, and the user can view the detailed data by hovering the mouse.
- data conversion: If you need to convert the data, you can choose the built-in conversion methods such as squaring, natural logarithm, and so on.
- Save & Share: The generated charts can be saved and shared via screenshot or export function.
Functional operation details
bar chart
Histogram is used to show the distribution of data, users can select different distribution types (such as Gaussian distribution, uniform distribution, etc.) to view the distribution characteristics of the data. The operation steps are as follows:
- Select Variable: Select the variables to be displayed after the data has been loaded.
- Select Distribution Type: Select the distribution type in the histogram settings.
- Generate Charts: Click on the "Generate Chart" button and the histogram will be automatically generated and displayed.
scatterplot
Scatterplots are used to show the relationship between two variables, and users can add filters to view a specific subset of the data. The procedure is as follows:
- Select Variable: Select two variables to be displayed, the first as the X-axis and the second as the Y-axis.
- Add Filter: Add filters as needed to control the range of variable values.
- Generate Charts: Click on the "Generate Chart" button and the scatterplot will be automatically generated and displayed.
correlation matrix
The correlation matrix is used to show the linear correlation between multiple variables, with colors distinguishing between positive and negative correlations. The procedure is as follows:
- Select Variable: Select multiple variables that need to be displayed.
- Generating matrices: Click on the "Generate Matrix" button and the relevant matrix will be automatically generated and displayed.
data conversion
Visprex provides a variety of data conversion methods, users can choose different conversion methods to process data according to their needs. The steps are as follows:
- Select Variable: Select the variable to be converted.
- Select Conversion Method: Select the conversion method (e.g. square, natural logarithm, etc.) in the conversion settings.
- Application Conversion: Click the "Apply Conversion" button and the data will be converted and displayed automatically.
© Copyright notes
Article copyright AI Sharing Circle All, please do not reproduce without permission.
Related posts

No comments...


