
General Introduction
Charts Not Chapters is an AI-based tool focused on converting text and data into compelling infographics. It is unique in that it does not rely on templates, but instead generates each chart from scratch through AI, offering a high degree of customizability. Users can import data from text, spreadsheets, or CSV files, and AI will analyze and automatically select the most appropriate chart type, such as bar charts, pie charts, or flowcharts. The site is designed to help users present complex data in the most intuitive way for research reports, marketing, educational content and social media sharing.
Compare well-known infographic generation tools Napkin Charts Not Chapters supports more input formats and has a wider range of infographic presentations, such as displaying data analysis charts, which is difficult for Napkin to do.
图表-1")
图表-1")
图表-1")
Function List
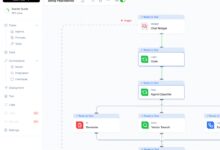
- AI generated charts: Generate infographics that meet your needs by talking to AI in real time.
- Intelligent format selection: AI automatically selects the optimal format and style to ensure the clarity and impact of the data presentation.
- Non-templated design: All charts are generated from scratch by AI, providing a high degree of editorial flexibility.
- Data import: Supports importing data from a variety of sources such as text, CSV, Excel, PDF, images, websites and more.
- Real-time customization: Users can quickly adjust chart colors, fonts, and other details by talking to the AI.
- Multi-format export: Supports exporting charts to EPS, PDF or HTML format for continued editing in other tools.
- sample chart (computing): Provides rich examples of auto-generated charts that demonstrate a variety of data insights.
Using Help
Main function operation flow
- Register & Login::
- Visit the Charts Not Chapters website, click on the "Register" button, and fill in the relevant information to complete your registration.
- Log in to the site using your registered account and password.
- Creating Infographics::
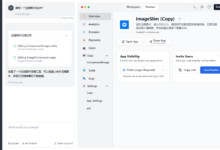
- Once you have logged in, click on the "Start Free" button to go to the chart creation page.
- Select the data source, which can be text, CSV, Excel, PDF, image, website, etc.
- Once the data is entered or uploaded, the AI automatically analyzes it and generates preliminary charts.
- Customized Charts::
- Adjust the formatting, colors, fonts, and other details of the chart by talking to the AI in real time.
- AI automatically selects the best chart format and style based on the user's instructions.
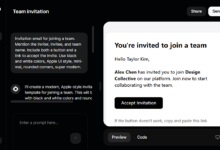
- Export & Share::
- After completing the chart customization, users can export the chart to EPS, PDF or HTML format.
- Exported diagrams can be further edited in tools such as Adobe Illustrator, Photoshop, or used directly for presentation and sharing.
Featured Functions Operation Procedure
- Intelligent format selection::
- After the data is entered or uploaded, AI automatically selects the most suitable data presentation format, such as list, comparison chart, flowchart, pie chart, bar chart, etc.
- Users can further optimize chart formatting by talking to the AI.
- Non-templated design::
- All charts are generated from scratch by AI and can be highly customized by the user.
- This design approach ensures the uniqueness and flexibility of the charts.
- Data import and conversion::
- Supports importing data from multiple sources, including text, CSV, Excel, PDF, images, websites, etc.
- The AI automatically analyzes and transforms the data to generate the appropriate charts.
- Real-time customization and editing::
- Users can adjust various details of the chart, such as color, font, size, etc. in real time by talking to the AI.
- This interaction makes the chart customization process more efficient and convenient.
With the above detailed operating procedures, users can easily get started with Charts Not Chapters to create professional and eye-catching infographics that enhance content presentation.